Randomized Controlled Trial
. 2013 Apr;16(4):486-92.
doi: 10.1038/nn.3331. Epub 2013 Feb 17.

Neural representations of events arise from temporal community structure

Affiliations
Randomized Controlled Trial

Neural representations of events arise from temporal community structure

Anna C Schapiro et al. Nat Neurosci. 2013 Apr.

Abstract

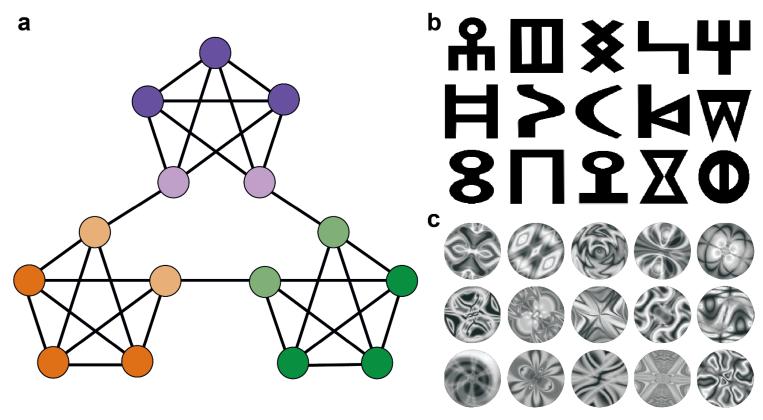
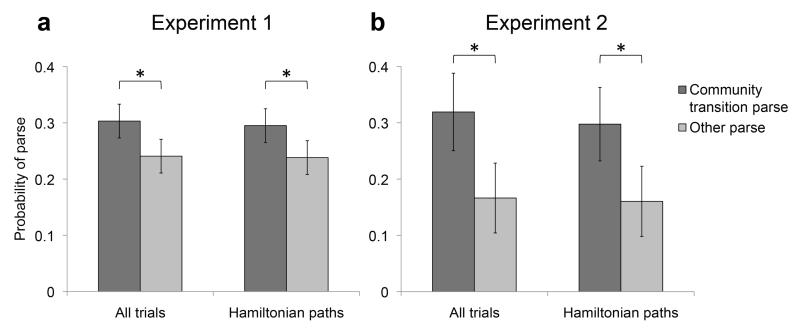
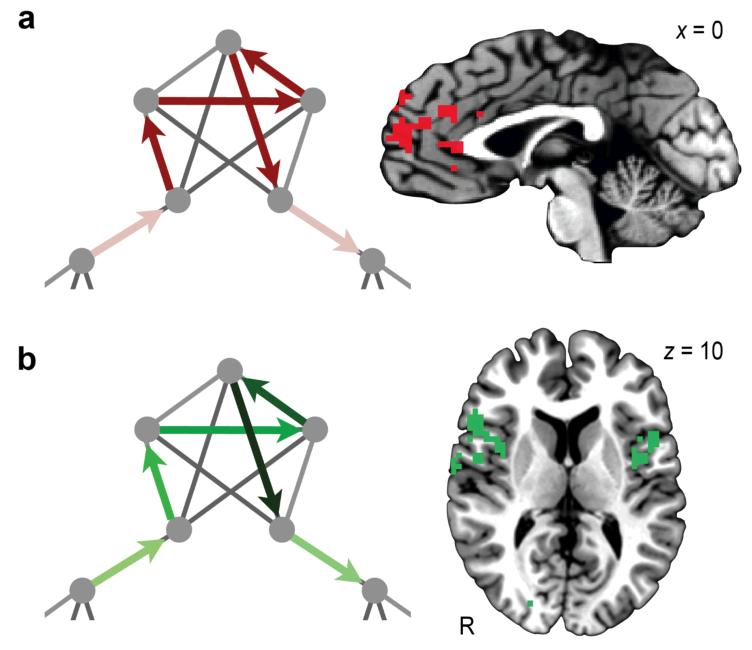
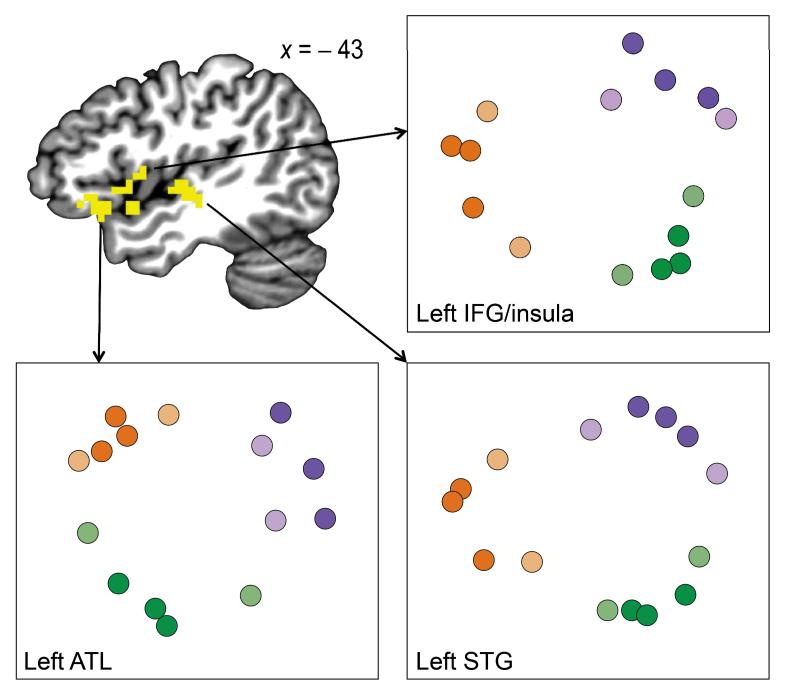
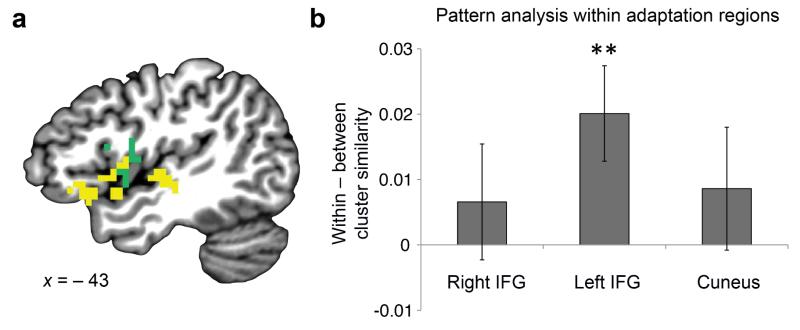
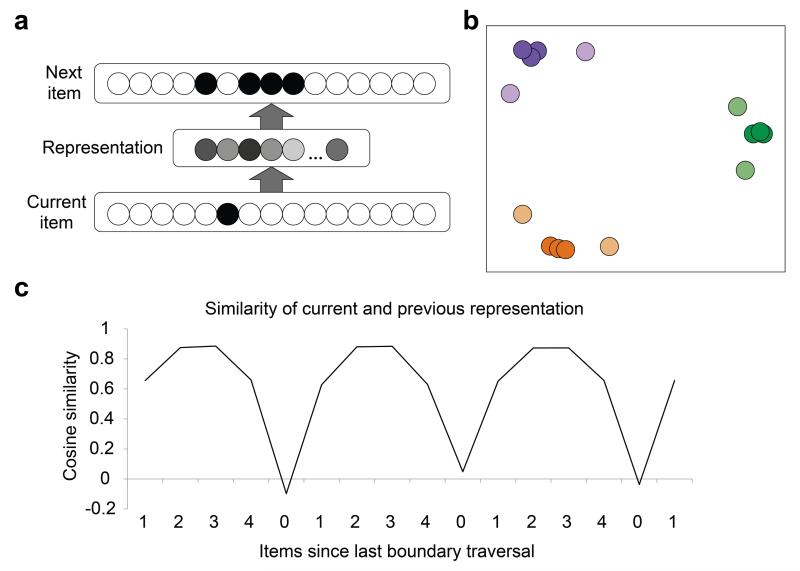
Our experience of the world seems to divide naturally into discrete, temporally extended events, yet the mechanisms underlying the learning and identification of events are poorly understood. Research on event perception has focused on transient elevations in predictive uncertainty or surprise as the primary signal driving event segmentation. We present human behavioral and functional magnetic resonance imaging (fMRI) evidence in favor of a different account, in which event representations coalesce around clusters or 'communities' of mutually predicting stimuli. Through parsing behavior, fMRI adaptation and multivoxel pattern analysis, we demonstrate the emergence of event representations in a domain containing such community structure, but in which transition probabilities (the basis of uncertainty and surprise) are uniform. We present a computational account of how the relevant representations might arise, proposing a direct connection between event learning and the learning of semantic categories.


Figures

Figure 1
Figure 1
Design and stimuli. (a) Graph with community structure, used to generate stimulus sequences. (b) Stimuli in experiment 1. (c) Stimuli in experiments 2 and 3.
Figure 2
Figure 2
Behavioral results. (a,b) For experiment 1 (a) and experiment 2 (b), the proportions of times participants parsed at a cluster transition and elsewhere in the sequence out of all opportunities to do so. Data were analyzed for all trials and restricted to Hamiltonian paths. *P < 0.05. Error bars denote 1 s.e.m. (30 participants for a, 10 for b).
Figure 3
Figure 3
Results of GLM analyses. (a) mPFC was engaged throughout the duration of an event. This response reflects stronger activity within a community (dark red arrows) compared with at a community boundary (light red arrows). The arrows outline a possible Hamiltonian trajectory through the displayed portion of the graph. (b) Bilateral IFG and insula showed a repetition enhancement effect, reflecting progressively greater activity as more items from the same community were viewed, illustrated here with darker shades of green later in a community traversal (20 participants for a,b). R, right.
Figure 4
Figure 4
Pattern similarity results. Clusters in left IFG and insula, left ATL, and left STG showed reliable community structure in the BOLD response in a whole-brain searchlight analysis. The similarity structure in each area was visualized by performing multi-dimensional scaling on the distances between the multivoxel pattern evoked by each item with each other item (averaged across searchlights within the area). Items are color-coded in accordance with the graph nodes in Figure 1a (20 participants).
Figure 5
Figure 5
Neighboring regions found in adaptation and pattern analysis. (a) To visualize the proximity of the regions, the adaptation (green) and pattern analysis (yellow) results are displayed on the same brain. (b) To provide a sensitive measure of possible overlap between these results, we calculated the average multivoxel pattern analysis effect across searchlights within each of the three clusters identified by the adaptation analysis. In the left IFG cluster only, we found higher pattern similarity for within-versus between-community items. **P < 0.01. Error bars denote ± 1 s.e.m. (20 participants for a,b).
Figure 6
Figure 6
Model architecture and results. (a) Feed-forward neural network model that predicts subsequent observations given the current observation. (b) Multi-dimensional scaling of the hidden unit representations after sequence exposure. The dot colors correspond to positions on the graph shown in Figure 1a. (c) The average cosine similarity in the hidden layer representations between the current item and the last item in a traversal through a Hamiltonian path of the graph. Results represent an average over 20 networks initialized with different random seeds.

References

    1. Speer NK, Swallow KM, Zacks JM. Activation of human motion processing areas during event perception. Cogn. Affect. Behav. Neurosci. 2003;3:335–345. - PubMed
    1. Newtson D. Attribution and the unit of perception of ongoing behavior. J. Pers. Soc. Psychol. 1973;28:28–38.
    1. Reynolds JR, Zacks JM, Braver TS. A computational model of event segmentation from perceptual prediction. Cogn. Sci. 2007;31:613–643. - PubMed
    1. Baldwin D, Andersson A, Saffran J, Meyer M. Segmenting dynamic human action via statistical structure. Cognition. 2008;106:1382–1407. - PubMed
    1. Zacks JM, Kurby CA, Eisenberg ML, Haroutunian N. Prediction error associated with the perceptual segmentation of naturalistic events. J. Cogn. Neurosci. 2011;23:4057–4066. - PMC - PubMed

Publication types