

doi: 10.1038/nmeth.2372.
Epub 2013 Feb 17.
Single-chromosome transcriptional profiling reveals chromosomal gene expression regulation
Affiliations
- PMID: 23416756
- PMCID: PMC4131260
- DOI: 10.1038/nmeth.2372
Item in Clipboard
Single-chromosome transcriptional profiling reveals chromosomal gene expression regulation
Nat Methods.
2013 Mar.
Erratum in
- Nat Methods. 2013 May;10(5):445
Abstract
We report intron chromosomal expression FISH (iceFISH), a multiplex imaging method for measuring gene expression and chromosome structure simultaneously on single chromosomes. We find substantial differences in transcriptional frequency between genes on a translocated chromosome and the same genes in their normal chromosomal context in the same cell. Correlations between genes on a single chromosome pointed toward a cis chromosome-level transcriptional interaction spanning 14.3 megabases.
Figures
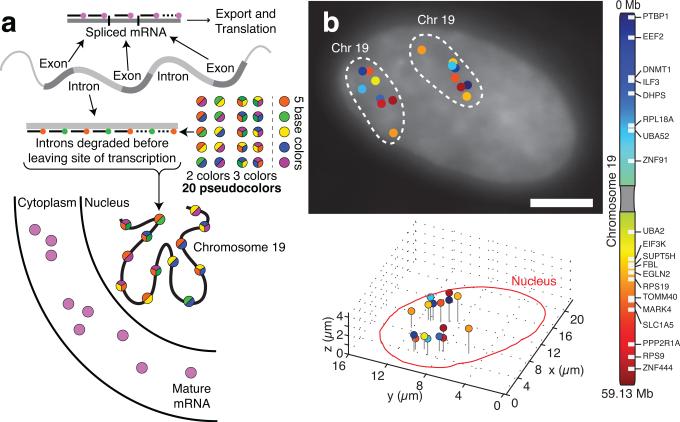
a. Depiction of our pseudocoloring scheme for labeling the site of transcription by targeting gene introns with a series of labeled oligonucleotide probes. b. Using images from each fluorescence channel, we computationally identified the transcriptional activity and location of the 20 genes. Along with probes targeting the introns, we also included probes targeting Cyclin A2 mRNA to determine position in cell cycle and SUZ12 mRNA as a fiducial marker. The scale bar is 5μm long.
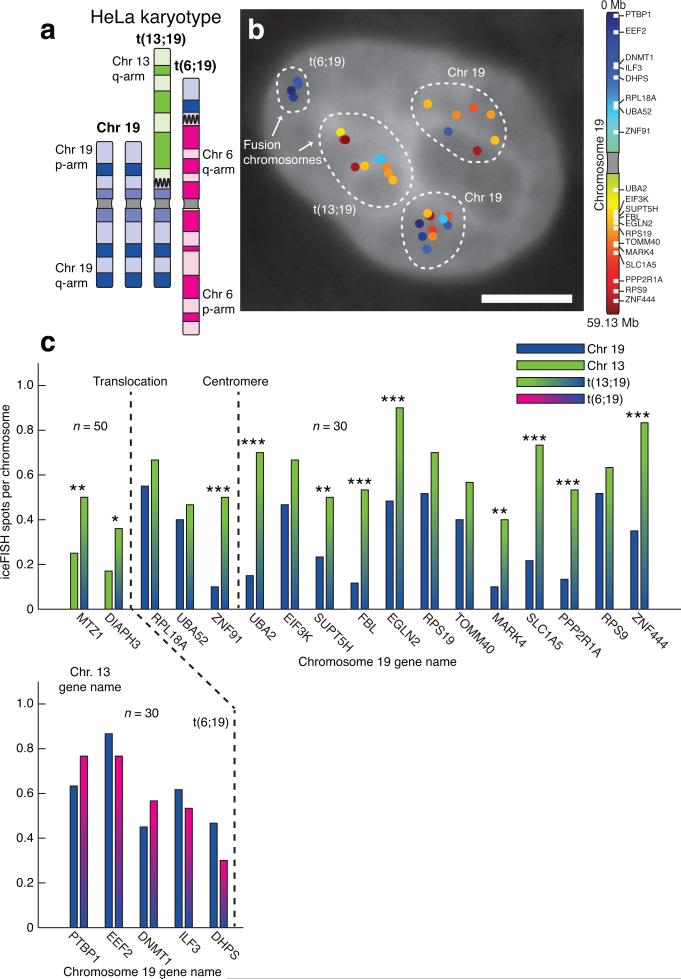
a. Schematic showing chromosome 19 and its derivatives in our HeLa cells. b. Computational identification of actively transcribing genes on chromosome 19 revealed the two intact copies and the two translocated pieces of chromosome 19. The scale bar is 5μm long. c. Comparison of the transcriptional activity of the genes on chromosome 19 (as measured by frequency of observing a transcription site per chromosome) on the translocated fragments of chromosome 19 to the intact copies of chromosome 19. For the expression of the two genes on chromosome 13 (MTZ1 and DIAPH3), we measured spot frequency as described in Supplementary fig. 15. We denote p-values for the difference in frequency (using a binomial distribution test) by *** for p<0.001, ** for p<0.01, * for p<0.05.
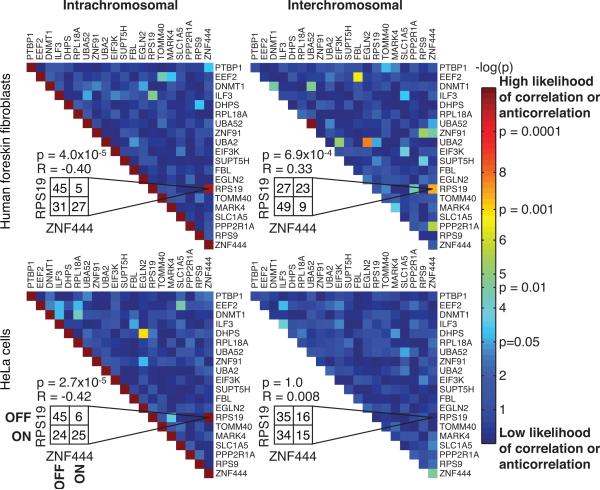
a. Intrachromosomal cis transcriptional interactions between two genes would result in a correlation or anti-correlation in the transcriptional activity of the two genes on the same chromosome, whereas trans effects would yield interchromosomal interactions. b. Heat map showing the deviation from independence of the intra and interchromosomal transcriptional activity of all pairs of genes we measured in human foreskin fibroblasts and the two intact copies of chromosome 19 in HeLa cells (p-value calculated using the Fisher Exact Test; see methods). A smaller p-value indicates a more significant deviation from independence. Here, we have presented data combined from two independent biological replicates (see Supplementary figs. 18 & 19 for replicates).
References
-
- Fraser P, Bickmore W. Nuclear organization of the genome and the potential for gene regulation. Nature. 2007;447:413–417. - PubMed
-
- Cremer T, Cremer C. Chromosome territories, nuclear architecture and gene regulation in mammalian cells. Nat Rev Genet. 2001;2:292–301. - PubMed
-
- Femino AM, Fay FS, Fogarty K, Singer RH. Visualization of single RNA transcripts in situ. Science. 1998;280:585–590. - PubMed
-
- Fremeau RT, Lundblad JR, Pritchett DB, Wilcox JN, Roberts JL. Regulation of pro-opiomelanocortin gene transcription in individual cell nuclei. Science. 1986;234:1265–1269. - PubMed
Publication types
MeSH terms
Substances
Grants and funding
LinkOut - more resources
Full Text Sources
Other Literature Sources
