. 2013 Mar;20(3):387-95.
doi: 10.1038/nsmb.2509. Epub 2013 Feb 17.

Transcription forms and remodels supercoiling domains unfolding large-scale chromatin structures

Affiliations

Transcription forms and remodels supercoiling domains unfolding large-scale chromatin structures

Catherine Naughton et al. Nat Struct Mol Biol. 2013 Mar.

Abstract

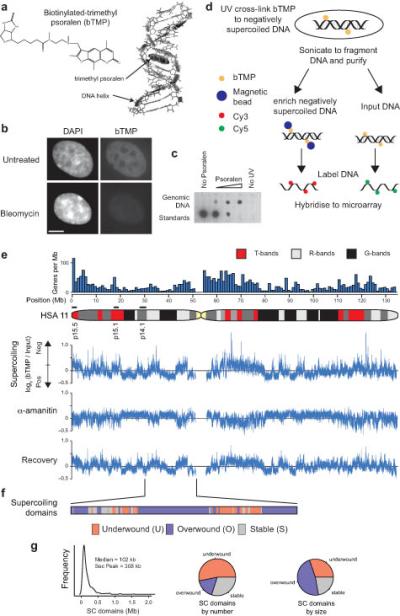
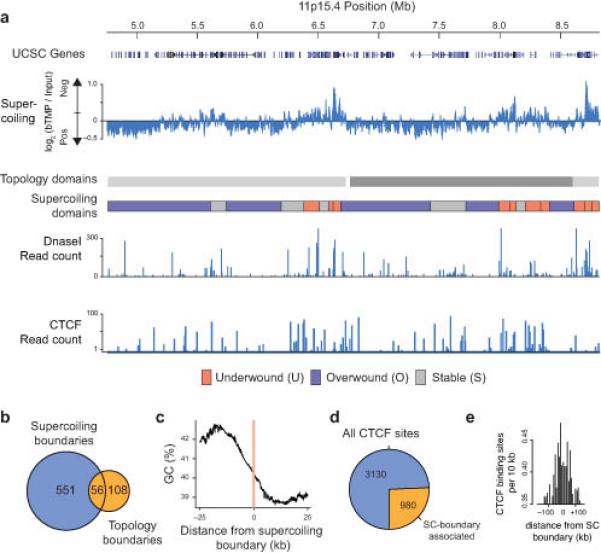
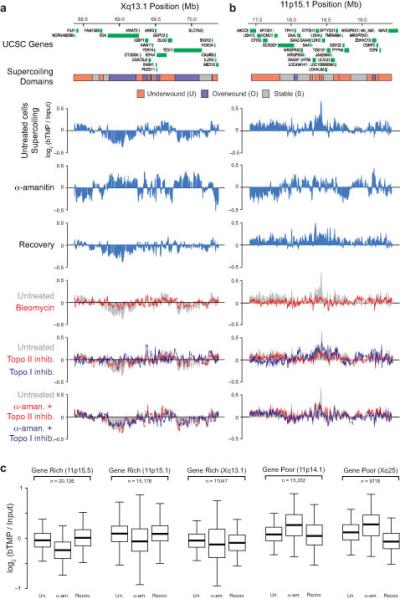
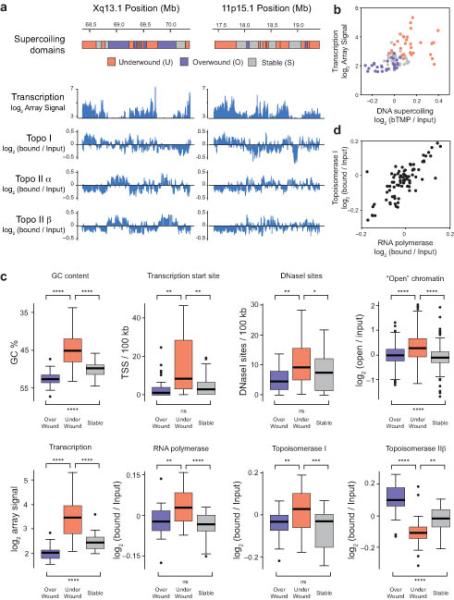
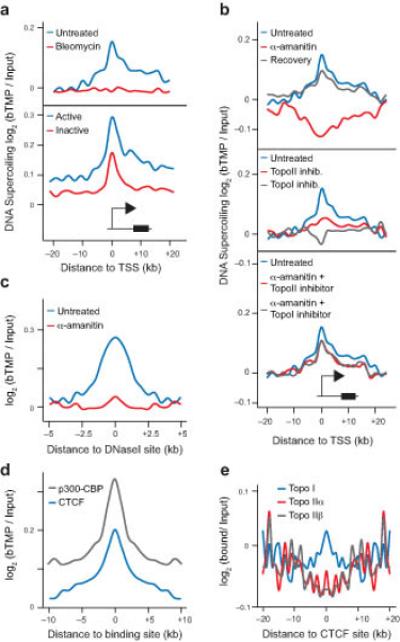
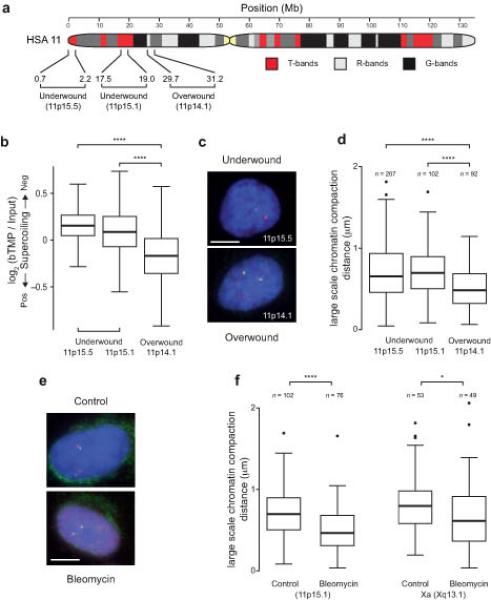
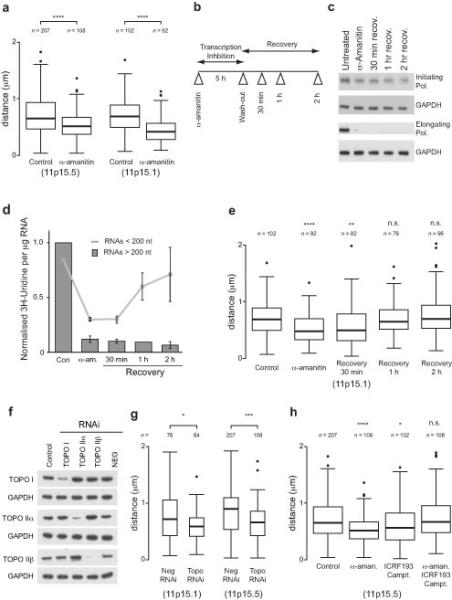
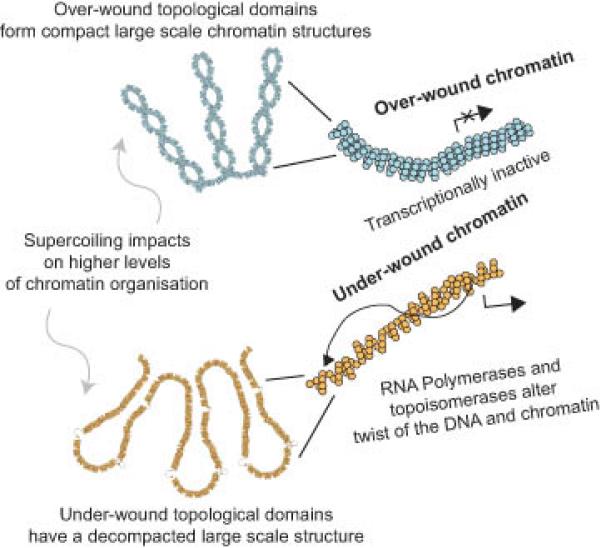
DNA supercoiling is an inherent consequence of twisting DNA and is critical for regulating gene expression and DNA replication. However, DNA supercoiling at a genomic scale in human cells is uncharacterized. To map supercoiling, we used biotinylated trimethylpsoralen as a DNA structure probe to show that the human genome is organized into supercoiling domains. Domains are formed and remodeled by RNA polymerase and topoisomerase activities and are flanked by GC-AT boundaries and CTCF insulator protein-binding sites. Underwound domains are transcriptionally active and enriched in topoisomerase I, 'open' chromatin fibers and DNase I sites, but they are depleted of topoisomerase II. Furthermore, DNA supercoiling affects additional levels of chromatin compaction as underwound domains are cytologically decondensed, topologically constrained and decompacted by transcription of short RNAs. We suggest that supercoiling domains create a topological environment that facilitates gene activation, providing an evolutionary purpose for clustering genes along chromosomes.


Figures

Figure 1
Figure 1
High resolution mapping of DNA supercoiling. (a) Cartoon showing biotinylated-trimethyl psoralen (bTMP) as a DNA structure probe that intercalates into under-wound regions of the DNA helix, . (b) Immunofluorescence analysis in RPE1 cells showing the distribution UV cross-linked bTMP detected using NeutraAvidin-Fluorescein before and after bleomycin treatment. Cells were counterstained with DAPI (Bar is 5 μm). (c) Dotblot showing bTMP incorporated into genomic DNA detected by streptavidin conjugated horseradish peroxidase and chemiluminescence. (d) Experimental strategy for high resolution mapping of DNA supercoiling. Cells were treated with bTMP for 20 mins and the bTMP was cross-linked into the DNA helix with 360 nm UV light. DNA was purified, enriched for biotin-TMP using streptavidin coated magnetic beads, amplified, labeled and hybridized to genomic microarrays versus input control. (e) Microarray data showing bTMP binding across human (HSA) chromosome 11 as log2(bTMP binding/Input DNA) revealing pronounced differences in drug binding representative of differences in DNA supercoiling. Transcription inhibition with α-amanitin (5 hours) showed substantial remodeling of DNA supercoiling that was reversed upon drug washout (2 hours recovery). (f) Diagram showing supercoiling domains across 20 Mb of HSA Chr11p identified as regions that were remodeled after transcription inhibition and categorized as “under-wound”, “over-wound” or “stable”. (g) Size distribution of supercoiling domains across regions studied and pie charts showing size and frequency distribution of different domain categories.
Figure 2
Figure 2
Organization and boundaries of supercoiling domains. (a) Microarray data showing bTMP binding, indicative of DNA supercoiling, at HSA 11p15.4 spanning two topological domains. Distribution of DNaseI sensitive sites and CTCF binding sites in RPE1 cells obtained from the ENCODE project. (b) Venn diagram showing the overlap between topological domain boundaries and supercoiling (SC) boundaries across HSA 11. The overlap was determined by taking a +/− 20 kb window at each topological boundary and assessing whether this overlapped with a SC boundary (P < 0.01 by random permutation). (c) Graph showing the base composition around SC boundaries. (d) Pie chart showing the number of CTCF sites on HSA11 located near to a SC-boundary. The overlap was determined by counting the number of CTCF binding sites within a +/− 20 kb window at each SC-boundary. (e) Bar chart showing the number of CTCF binding sites surrounding a SC-boundary (KS test compared to randomly generated data, P < 2.2 × 10⁻¹⁶).
Figure 3
Figure 3
Transcription and topoisomerase dependent remodeling of DNA supercoiling. Diagrams showing the arrangement of genes and supercoiling domains at HSA Xq13.1 (a) and HSA 11p15.1 (b) and microarray data showing bTMP binding presented as log2(bTMP binding/ Input), indicative of DNA supercoiling. The effect of transcription and topoisomerases on supercoiling was investigated using inhibitors. Cells were either treated with bleomycin (10 min) or transcriptionally blocked using α-amanitin (α-aman.) for 5 hours in the presence or absence of topoisomerase inhibitors (camptothecin, topoisomerase I inhibitor (topo I inhib.); and ICRF193, topoisomerase II inhibitor (topo II inhib.), as shown. (c) Boxplots showing the quantification of DNA supercoiling at gene rich and poor genomic loci. (Un., untreated; α-am., α-amanitin; Recov., Recovery). For the boxplots, the bottom and top of the box are the 25th and 75th percentile and the band near the middle is the median whilst the whiskers show 1.5 x the interquartile range. n corresponds to the number of probes analyzed in the locus. For all transitions P < 2.2 × 10⁻¹⁶ (t-test).
Figure 4
Figure 4
RNA polymerase and topoisomerases define supercoiling domains. Diagrams showing the arrangement of supercoiling domains at HSA Xq13.1 (a) and HSA 11p15.1 (b) and microarray data showing the distribution of RNA transcripts and ChIP for topoisomerase (topo) I, topoisomerase IIα and IIβ binding across the genomic loci. Transcription is presented as log2 (array signal) whilst ChIP data is shown as log2 (bound/input). B. Scatter plot showing the relationship between transcription and DNA supercoiling in under-wound, over-wound and stable domains. (c) Boxplots showing GC content, transcription start site density, DNaseI site frequency, “open chromatin”, RNA transcription, RNA polymerase II binding, topoisomerase I and topoisomerase IIβ binding at “over-wound”, “under-wound” or “stable” supercoiling domains. Boxplots are as described in Fig. 3 and outliers are shown as black dots. Significance was assessed by t-test and asterisks correspond to the P-value (no *, P > 0.05; *, P < 0.05; **, P < 0.01; ***, P < 0.001; ****, P < 0.0001). (d) Scatterplot showing the relationship between topoisomerase I and RNA polymerase II binding within different supercoiling domains.
Figure 5
Figure 5
DNA supercoiling around TSSs and regulatory elements. (a) Graph showing bTMP binding, indicative of DNA supercoiling, +/− 20 kb around transcription start sites (TSSs) in the presence or absence of bleomycin for active and inactive genes. (b) Profiles showing the changes in DNA supercoiling around TSSs after inhibiting RNA polymerases and topoisomerases. (c) Graph showing distribution of DNA supercoiling +/−5 kb of DNaseI sensitive sites before and after transcription inhibition. (d) Profile of DNA supercoiling +/− 10 kb around CTCF and p300-CBP binding sites. CTCF binding sites for RPE1 cells were obtained from the ENCODE project. p300-CBP binding sites are for A549 cells from the ENCODE project. (e) Graph showing topoisomerase binding +/− 20 kb around CTCF binding sites as determined by ChIP-microarray. T-tests were used to show the peak signal was significantly different to randomly generated background data, P < 2.2 × 10⁻¹⁶.
Figure 6
Figure 6
Under-wound domains are cytologically decondensed and torsionally constrained. (a) Ideogram of human (HSA) chromosome 11 showing T-bands, R-bands, G-bands and probe positions at the under and over-wound 1.5 Mb chromosomal loci studied. (b) Boxplot showing the DNA supercoiling at the under-wound 11p15.5 and 15.1 loci and at the over-wound 11p14.1 loci, as measured by bTMP binding. (c) Representative images showing 3D DNA FISH of pairs of labeled fosmid probes (red and green spots) positioned 1.5 Mb apart either side of the loci to measure large-scale chromatin compaction. Nuclei are counterstained with DAPI. Bar is 5 μm. (d) Boxplots showing the distance between pairs of fosmid probes as a measure of chromatin compaction at under-wound and over-wound genomic loci. (e) Representative images showing 3D DNA FISH of pairs of labeled fosmid probes (red and green spots) positioned 1.5 Mb apart at 11p15.1 in the presence and absence of bleomycin. Nuclei are counterstained with DAPI. Bar is 5 μm. (f) Boxplot showing the change in large-scale chromatin compaction at the 11p15.1 and Xq13.1 loci after treatment with bleomycin. Boxplots are as described in Fig. 4 and asterisks correspond to P-values determined by Wilcoxon test, also as described in Fig. 4. n is the number of separate probe pairs examined.
Figure 7
Figure 7
Transcription and topoisomerase dependence of large-scale chromatin structures. (a) Boxplot showing the change in large-scale chromatin compaction using 3D DNA FISH at the 11p15.5 and 11p15.1 loci after 5 hrs α-amanitin treatment to inhibit transcription. (b) Schematic showing the experimental approach used to investigate changes in chromatin structure after transcription inhibition and recovery. (c) Western blot showing the global levels of RNA polymerase using antibodies against differently activated forms of the polymerase after transcription inhibition. GAPDH is shown as a loading control. (d) Graph showing incorporation of 3H-Uridine into short (< 200 nt) and long (> 200 nt) RNA after 30 min pulse labeling to measure RNA synthesis after inhibition of transcription by α-amanitin followed by recovery. Error bars are s.d. (n = 3). (e) Boxplots showing the compaction of the 11p15.1 locus after transcription inhibition and drug washout. (f) Western blot showing the loss of topoisomerase (topo) I and II proteins after topoisomerase RNAi. GAPDH is shown as a loading control. (g) Boxplot showing distance between pairs of fosmid probes at 11p15.1 and 11p15.5 loci after topoisomerase RNAi (Neg., negative; topo, topoisomerase). (h) Boxplot showing distance between pairs of fosmid probes at the 11p15.1 locus after transcription inhibition by α-amanitin in the presence or absence of topoisomerase inhibitors, ICRF193 or camptothecin. Boxplots are as described in Fig. 4 and asterisks correspond to P-values determined by Wilcoxon test, also as described in Fig. 4. n = the number of separate probe pairs examined. In panels (e) and (h), P-values are calculated compared to control.
Figure 8
Figure 8. Relationship between transcription, DNA supercoiling and large-scale chromatin structures
Transcriptionally inactive chromatin is topologically over-wound and has a cytologically compact large scale chromatin structure. In contrast transcriptionally active regions or transcriptional activation alters DNA supercoiling, remodeling supercoiling domains and is accompanied by a decompaction of large scale chromatin structures. Therefore, large structural domains, for example as described by Hi-C, are subdivided into smaller transcription dependent supercoiling domains providing an additional level of functional organization within the human genome.

Comment in

References

    1. Sinden RR, Carlson JO, Pettijohn DE. Torsional tension in the DNA double helix measured with trimethylpsoralen in living E. coli cells: analogous measurements in insect and human cells. Cell. 1980;21:773–783. - PubMed
    1. Ljungman M, Hanawalt PC. Localized torsional tension in the DNA of human cells. Proc. Natl. Acad. Sci. U. S. A. 1992;89:6055–6059. - PMC - PubMed
    1. Ljungman M, Hanawalt PC. Presence of negative torsional tension in the promoter region of the transcriptionally poised dihydrofolate reductase gene in vivo. Nucleic Acids Res. 1995;23:1782–1789. - PMC - PubMed
    1. Villeponteau B, Lundell M, Martinson H. Torsional stress promotes the DNAase I sensitivity of active genes. Cell. 1984;39:469–478. - PubMed
    1. Liu LF, Wang JC. Supercoiling of the DNA template during transcription. Proc. Natl. Acad. Sci. U. S. A. 1987;84:7024–7027. - PMC - PubMed

Reference for online methods

    1. Naughton C, et al. Progressive loss of estrogen receptor alpha cofactor recruitment in endocrine resistance. Mol. Endocrinol. 2007;21:2615–2626. - PubMed

Publication types

Associated data