. 2013 Mar;20(3):396-403.
doi: 10.1038/nsmb.2517. Epub 2013 Feb 17.

Transcription-dependent dynamic supercoiling is a short-range genomic force

Affiliations

Transcription-dependent dynamic supercoiling is a short-range genomic force

Fedor Kouzine et al. Nat Struct Mol Biol. 2013 Mar.

Abstract

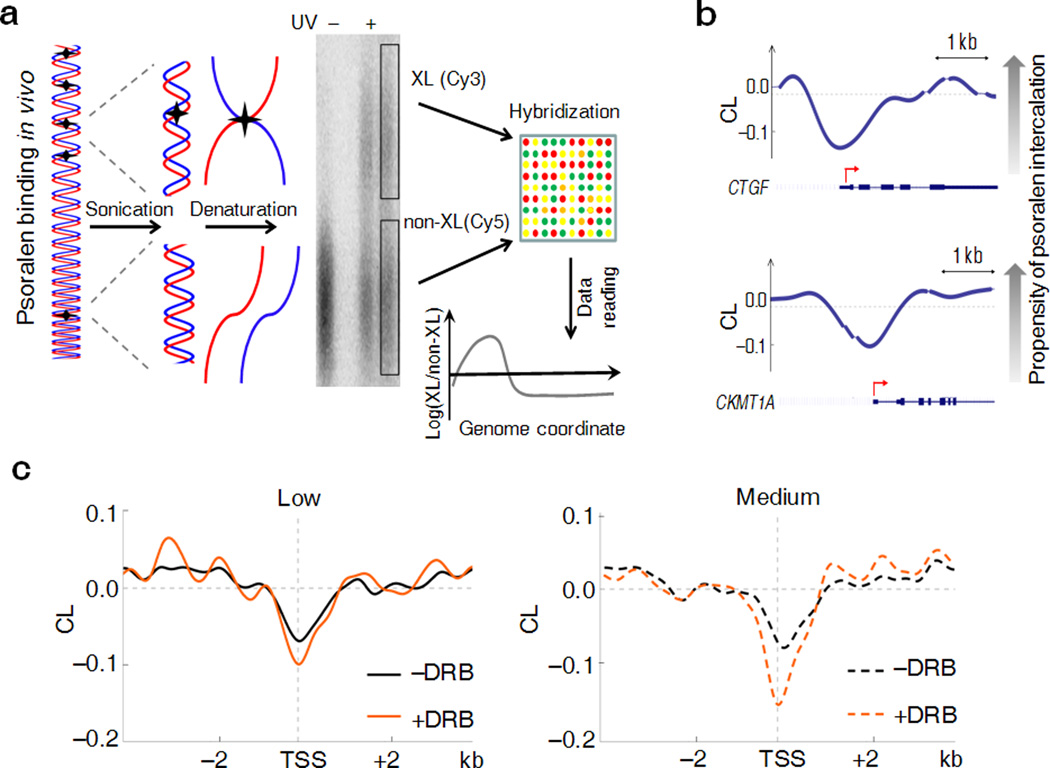
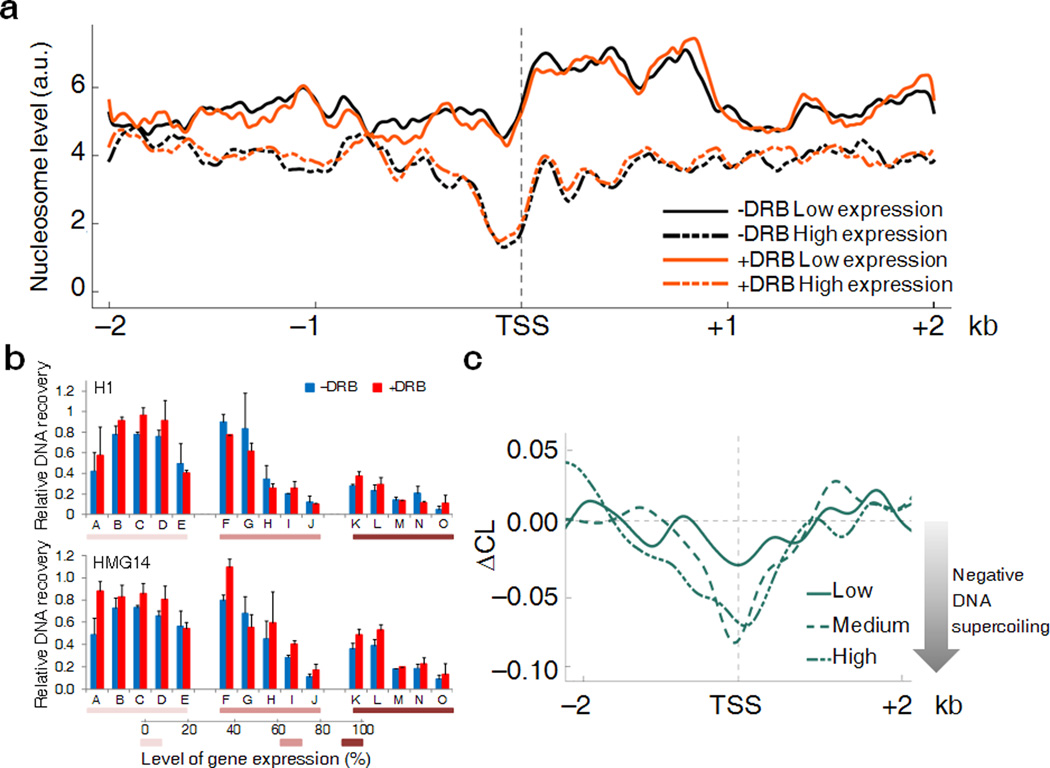
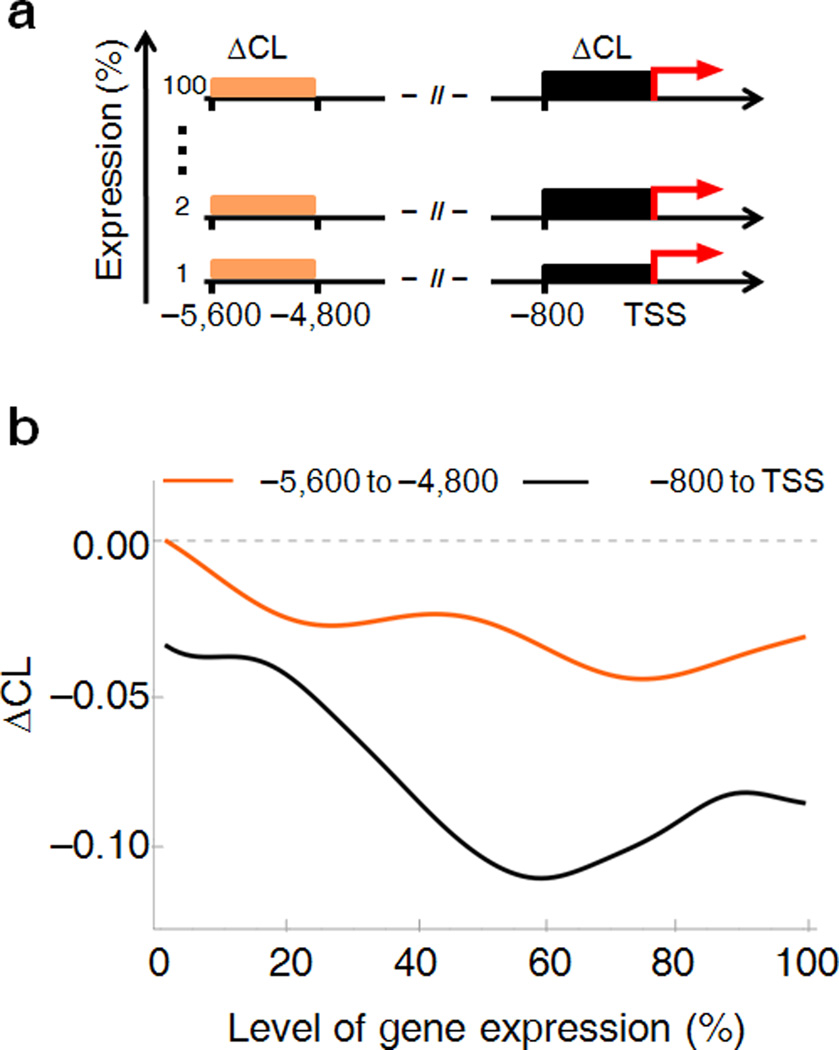
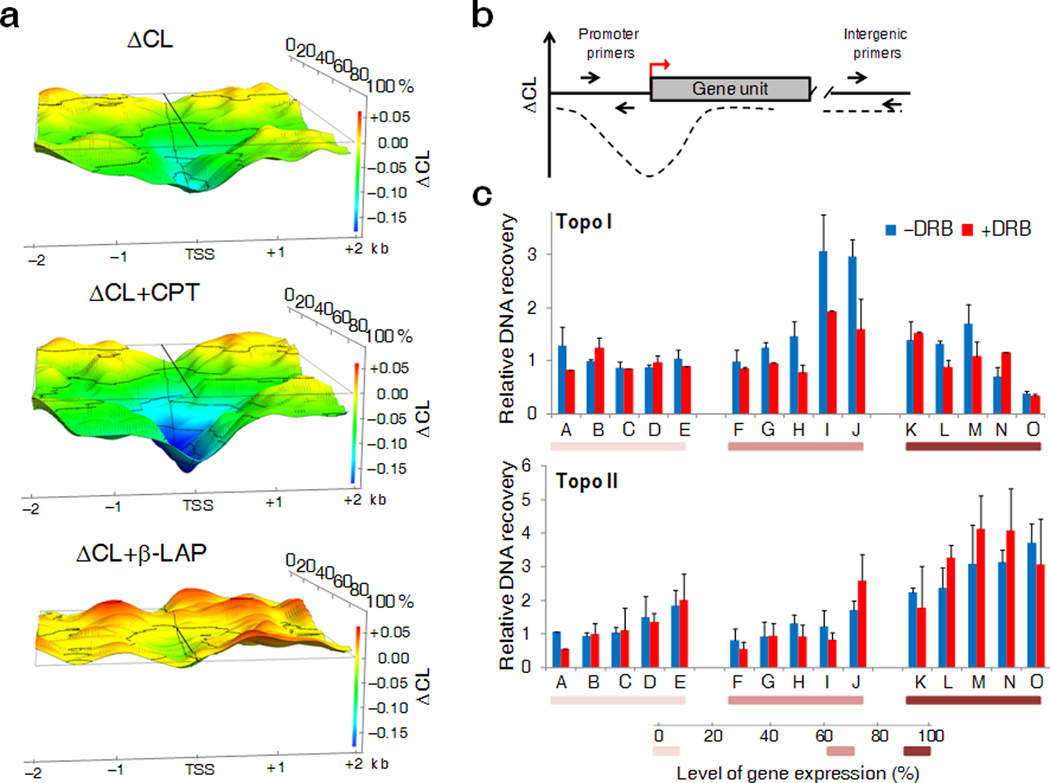
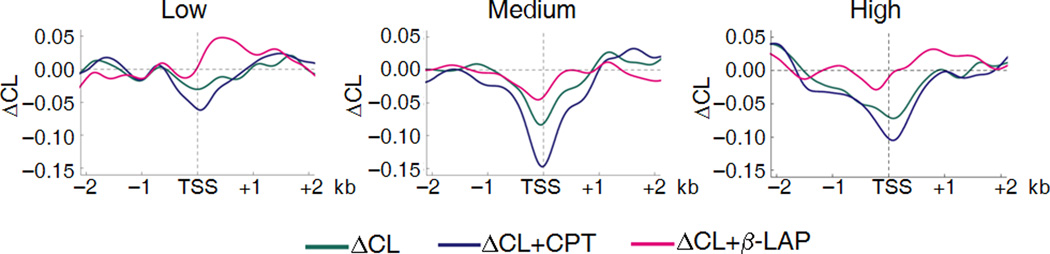
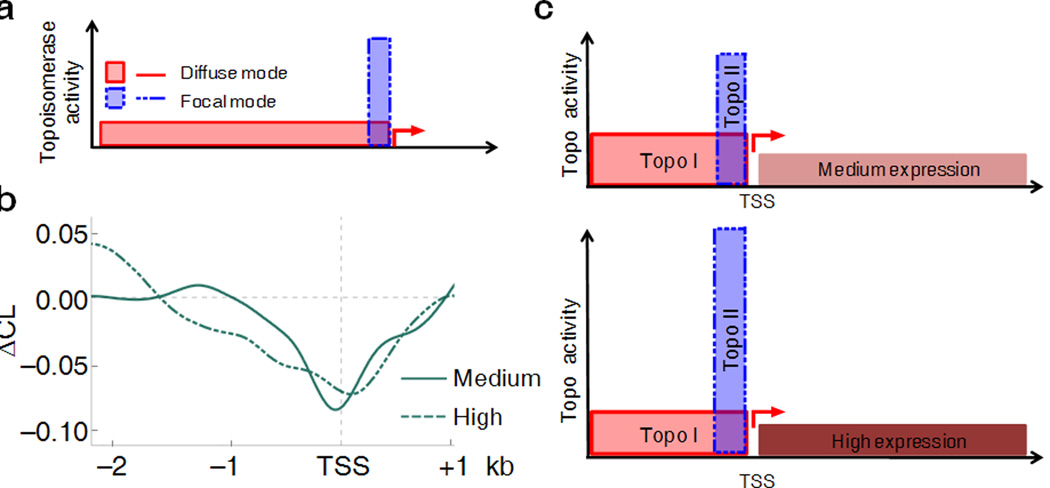
Transcription has the capacity to mechanically modify DNA topology, DNA structure and nucleosome arrangement. Resulting from ongoing transcription, these modifications in turn may provide instant feedback to the transcription machinery. To substantiate the connection between transcription and DNA dynamics, we charted an ENCODE map of transcription-dependent dynamic supercoiling in human Burkitt's lymphoma cells by using psoralen photobinding to probe DNA topology in vivo. Dynamic supercoils spread ~1.5 kilobases upstream of the start sites of active genes. Low- and high-output promoters handled this torsional stress differently, as shown by using inhibitors of transcription and topoisomerases and by chromatin immunoprecipation of RNA polymerase and topoisomerases I and II. Whereas lower outputs are managed adequately by topoisomerase I, high-output promoters additionally require topoisomerase II. The genome-wide coupling between transcription and DNA topology emphasizes the importance of dynamic supercoiling for gene regulation.


Figures

Figure 1
Figure 1. Psoralen photobinding is a genome-probe to detect DNA supercoiling in vivo
(a) Overview of the approach: treatment of cells with psoralen followed by UV irradiation produces DNA inter-strand crosslinks. Thermal denaturation of genomic DNA fragments results in the formation of two fractions (left). After denaturation, the cross-linked fraction (XL) migrates slowly in gels, while the uncross-linked (non-XL) population is composed of rapidly migrating single-stranded DNA (center). After electrophoretic separation these fractions are purified, fluorochrome labeled and hybridized with densely tiled oligonucleotide arrays (right). The genomic distribution of the ratio of cross-linked and uncross-linked DNA (log 2 scale being 0 at the global mean) represents the efficiency of psoralen intercalation. (b) Representative examples of the psoralen cross-linking map show peculiarities near TSSs. The x axis shows genomic position. The y axis shows the CL level which is the log 2 ratio (crosslinked/un-crosslinked) of the fluorescent signals detected from the DNA microarray. Negative CL values indicate lower propensity of psoralen intercalation. Curves are computationally smoothed. The breaks in the curve correspond to the sequences that were not profiled on the microarray due to uniqueness and conformational issues. Schematic of the genes are represented below each curve with red arrows showing the TSSs. (c) Composite analysis of psoralen CL levels near the transcription start sites of low (from 0 to 20%, left panel) and medium (from 60 to 80% right panel) expressed ENCODE genes before and after treatment of cells with DRB.
Figure 2
Figure 2. DRB treatment does not affect nucleosome profiles or binding of non-nucleosomal proteins to DNA
(a) Nucleosome occupancy around the TSSs of low (solid lines) and high (dashed lines) expressed genes in presence (orange lines) or absence (black lines) of DRB. The y axis shows the level of nucleosome binding expressed as tags per million (arbitrary units). The x axis shows the genomic coordinate centered on the TSS. For each position the nucleosome coverage was determined by counting the number of nucleosomes mapping to that position. (b) Enrichment of H1 and HMG14 proteins at promoter regions of selected genes (indicated by alphabetical letter, see Online Methods for details) relative to a reference intergenic region before and after DRB treatment. Promoters are ranked in three groups which have, respectively from left to right, low, medium and high expression. Data are shown as percentage of input (n=3–4, error bars, s.d.). (c) DNA supercoiling around TSSs is determined for low, medium and high expressed genes. The y axis shows the ΔCL which is the computational difference between CL values derived from DRB-treated and DRB-untreated cells. Negative ΔCL values reflect a higher propensity of psoralen to intercalate into the DNA due to transcription-dependent negative supercoiling. The zero point represents absence of transcription-dependent supercoils.
Figure 3
Figure 3. Differential patterns of supercoil-generation for low-to-medium versus high transcribed genes
(a) Schematic representation describing the calculation used to determine the relationship between gene expression and DNA topology. (b) The ΔCL signal of upstream promoter-regions was averaged over 800 bp for each single gene and plotted against the level of gene expression (black curve). Smoothing of the curve was done by sliding window average. The ΔCL signal between −5,600 bp and −4,800bp (orange curve) was graphed for comparison.
Figure 4
Figure 4. Perturbing the distribution of supercoils with topoisomerase inhibitors reveals the pattern of Topo I and Topo II recruitment to TSSs
(a) 3-D representation of the ΔCL profiles of genes ranked according to their level of expression in the absence of topoisomerase inhibitors (top panel), in presence of CPT (central panel) or β-LAP (bottom panel). (b) Schematic representation of qPCR design for the ChIP analysis. DNA recovery was determined at promoters and at reference intergenic region. (c) Raji cells were treated with CPT or β-LAP in presence or absence of DRB and Topo I (top panel) or Topo II (bottom panel) occupancy was detected by ChIP. The relative enrichment of the topoisomerases at the promoter area of genes (indicated by alphabetical letter, see Online Methods for details) with different expression levels is shown. Five genes were analyzed in each expression range. Data are normalized to a non-expressed intergenic region (n=3–4, error bars, s.d.).
Figure 5
Figure 5
Comparison of ΔCL curves generated in the absence or presence of CPT or β-LAP inhibitors. From left to right respectively low, medium and high expressed genes are shown in each panel.
Figure 6
Figure 6. Differential topoisomerase I and II utilization in the regulation of transcription-induced torsional stress
(a) Two modes of topoisomerase recruitment at the upstream region of promoters: the diffuse mode (solid line) suggests that topoisomerases are randomly distributed over the upstream promoter regions; the focal mode (dashed line) hypothesizes that topoisomerases work near the TSS. The two modes can be visualized in panel (b) where the ΔCL curves for medium and high expressed genes were generated. (c) Proposed model of supercoiling regulation by topoisomerases. Dynamic supercoiling near medium active genes is managed mainly by Topo I which is distributed over a broad upstream promoter region; whereas highly active promoters recruit Topo II focally near the TSS.

Comment in

References

    1. Lavelle C. Forces and torques in the nucleus: chromatin under mechanical constraints. Biochem Cell Biol. 2009;87(1):307–322. - PubMed
    1. Liu LF, Wang JC. Supercoiling of the DNA template during transcription. Proc Natl Acad Sci U S A. 1987;84(20):7024–7027. - PMC - PubMed
    1. Baranello L, et al. The importance of being supercoiled: How DNA mechanics regulate dynamic processes. Biochim Biophys Acta. 2012;1819(7):632–638. - PMC - PubMed
    1. Darzacq X, et al. In vivo dynamics of RNA polymerase II transcription. Nature Structural & Molecular Biology. 2007;14(9):796–806. - PMC - PubMed
    1. Roca J. Transcriptional inhibition by DNA torsional stress. Transcription. 2011;2(2):82–85. - PMC - PubMed

Publication types

MeSH terms

Associated data