. 2013 Apr;31(4):335-41.
doi: 10.1038/nbt.2509. Epub 2013 Feb 17.

Compartmentalization of metabolic pathways in yeast mitochondria improves the production of branched-chain alcohols

Affiliations

Compartmentalization of metabolic pathways in yeast mitochondria improves the production of branched-chain alcohols

José L Avalos et al. Nat Biotechnol. 2013 Apr.

Abstract

Efforts to improve the production of a compound of interest in Saccharomyces cerevisiae have mainly involved engineering or overexpression of cytoplasmic enzymes. We show that targeting metabolic pathways to mitochondria can increase production compared with overexpression of the enzymes involved in the same pathways in the cytoplasm. Compartmentalization of the Ehrlich pathway into mitochondria increased isobutanol production by 260%, whereas overexpression of the same pathway in the cytoplasm only improved yields by 10%, compared with a strain overproducing enzymes involved in only the first three steps of the biosynthetic pathway. Subcellular fractionation of engineered strains revealed that targeting the enzymes of the Ehrlich pathway to the mitochondria achieves greater local enzyme concentrations. Other benefits of compartmentalization may include increased availability of intermediates, removing the need to transport intermediates out of the mitochondrion and reducing the loss of intermediates to competing pathways.


Figures
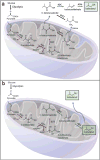
Figure 1
Figure 1
Isobutanol pathways. The upstream pathway (composed of ILV2, ILV5 and ILV3) is part of the valine biosynthetic pathway (red arrows), while the downstream pathway (composed of KDC and ADH) is the Ehrlich valine degradation pathway (green arrows). The α-ketoisovalerate (α-KIV) intermediate is interconverted to valine by BAT1 and BAT2. The upstream and downstream pathways are naturally separated between the mitochondria and cytoplasm, respectively (A). However, the pathway engineered via mitochondrial engineering targets the complete pathway to the mitochondrial compartment (B). Blue arrows depict transport across mitochondrial membranes.
Figure 2
Figure 2
Isobutanol production by yeast engineered with mitochondrial and partly cytoplasmic isobutanol pathways. (A) Average isobutanol titers in 24-h high cell-density fermentations in minimal medium of the three highest producing colonies of each construct. The right panel summarizes the isobutanol titers obtained by the incremental addition of components of an isobutanol pathway targeted to mitochondria. (B) Isobutanol specific productivities vs isobutanol titers in 24-h high cell density fermentations of partial and complete isobutanol pathways containing only upstream ILV genes (yellow square); or also with their downstream enzymes targeted to mitochondria (filled markers) or cytoplasm (open markers). These include one of three α-KDCs: Ll-kivd (red), Sc-kid1 (cyan) or Sc-aro10 (green); and either no ADH (diamond); or one of three ADHs: Sc-adh7 (circle), Ec-fucO (square), or Ll-adhARE1 (triangle); compared to empty plasmid (black full circle). Complete isobutanol pathways with their downstream enzymes targeted to the cytoplasm cluster with pathways overexpressing only the ILV genes, and are shaded in grey. Partial 4-gene isobutanol pathways containing α-KDCs targeted to mitochondria are shaded in red; and complete (5-gene) isobutanol pathways targeted to mitochondria are shaded in blue. (C) Time course of fermentations initiated at low cell densities in minimal medium. Strains with complete isobutanol pathways targeted to mitochondria are shown in continuous red (JAy153) and green (JAy161) lines; strains with the same downstream enzymes targeted to cytoplasm are shown in red (JAy166) and green (JAy174) dashed lines, respectively; strain JAy38 overexpressing only ILV genes is shown in yellow; and the background strain with empty plasmid (JAy2) is shown in black.
Figure 3
Figure 3
Cytoplasmic isobutanol production of a strain overexpressing Ll-kivd targeted to the cytoplasm, with or without addition of the α-ketoisovalerate intermediate to the culture media (A); compared to isobutanol production of strain Jay161 (which has a mitochondrial pathway) without adding α-ketoisovalerate (B).
Figure 4
Figure 4
Isopentanol and 2-methyl-1-butanol production. Specific productivity vs titer plots of isopentanol (A) and 2-methyl-1-butanol (B) obtained in 24-h high cell-density fermentations in minimal medium. The plots show the average titers and productivities of the three highest producing strains of each alcohol, for each construct. The constructs include partial and complete isobutanol pathways containing only upstream ILV genes (yellow square); or also with their downstream enzymes targeted to mitochondria (filled markers) or cytoplasm (open markers). These include one of three α-KDCs: Ll-kivd (red), Sc-kid1 (cyan) or Sc-aro10 (green); and either no ADH (diamond); or one of three ADHs: Sc-adh7 (circle), Ec-fucO (square), or Ll-adhARE1 (triangle); compared to empty plasmid (black full circle). (C) The isobutanol, isopentanol and 2-methyl-1-butanol biosynthetic pathways have a significant overlap in their upstream pathways (blue arrows); and identical downstream, Ehrlich degradation pathways (red boxes).
Figure 5
Figure 5
Subcellular distribution of α-KDCs and ADHs fused to –HA or –Myc tags respectively, and targeted to cytoplasm (CoxIV −) or mitochondria (CoxIV+). Gels were loaded with 20 μg of total protein from cytoplasmic (Cyt) or mitochondrial (Mit) fractions; or equal amounts of full cells (Full). Densitometry measurements of cytoplasmic and mitochondrial fractions are shown in histograms of relative intensities normalized to signals of enzymes targeted to the cytoplasm. Densitometry measurements of full cell samples (Full) are shown in separate histograms of relative intensities normalized to signals from strains with enzymes targeted to the cytoplasm. As controls, the distributions of PGK and porin, which are specific markers for the cytoplasmic and mitochondrial fractions respectively, were determined on the same blots.

Comment in

References

    1. Attardi G, Schatz G. Biogenesis of mitochondria. Annu Rev Cell Biol. 1988;4:289–333. - PubMed
    1. Fukuda H, Casas A, Batlle A. Aminolevulinic acid: from its unique biological function to its star role in photodynamic therapy. Int J Biochem Cell Biol. 2005;37:272–276. - PubMed
    1. Kohlhaw GB. Leucine biosynthesis in fungi: entering metabolism through the back door. Microbiol Mol Biol Rev. 2003;67:1–15. table of contents. - PMC - PubMed
    1. Kumar A, et al. Subcellular localization of the yeast proteome. Genes Dev. 2002;16:707–719. - PMC - PubMed
    1. Lange H, Kispal G, Lill R. Mechanism of iron transport to the site of heme synthesis inside yeast mitochondria. J Biol Chem. 1999;274:18989–18996. - PubMed

Publication types