. 2013 Jul;11(3):319-37.
doi: 10.1007/s12021-013-9178-1.

PRoNTo: pattern recognition for neuroimaging toolbox

Affiliations

PRoNTo: pattern recognition for neuroimaging toolbox

J Schrouff et al. Neuroinformatics. 2013 Jul.

Abstract

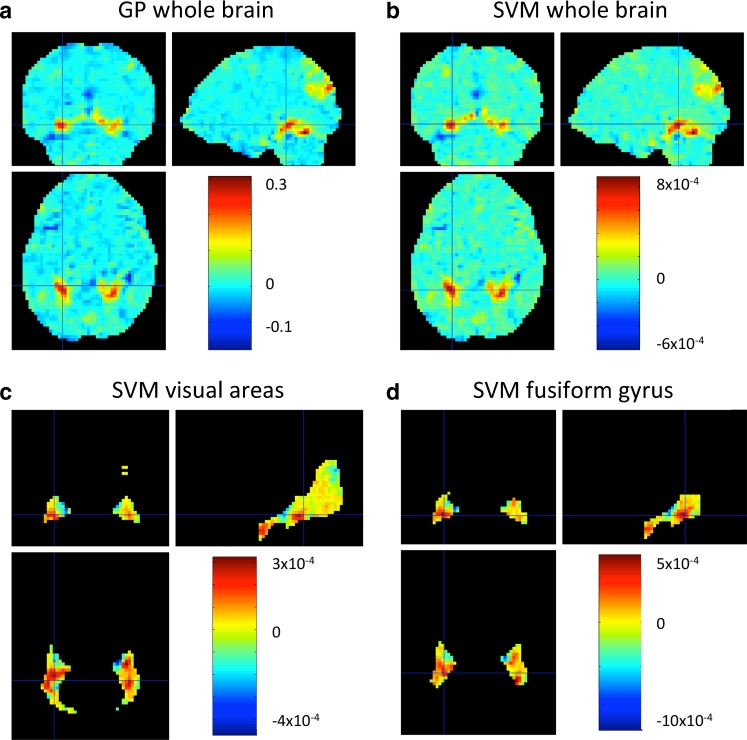
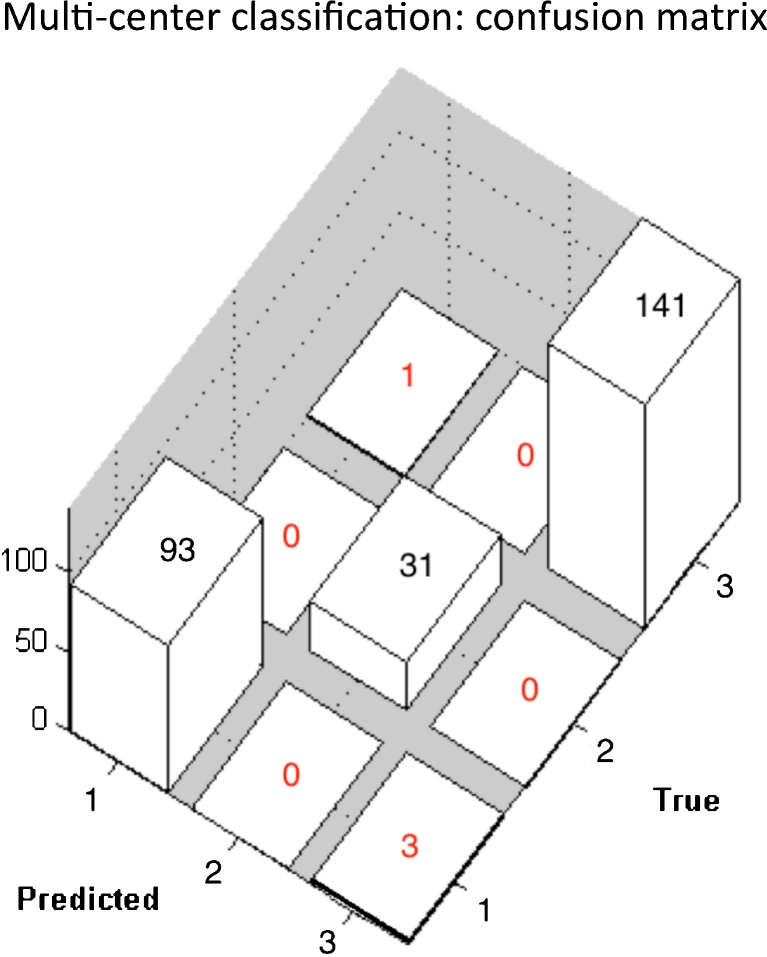
In the past years, mass univariate statistical analyses of neuroimaging data have been complemented by the use of multivariate pattern analyses, especially based on machine learning models. While these allow an increased sensitivity for the detection of spatially distributed effects compared to univariate techniques, they lack an established and accessible software framework. The goal of this work was to build a toolbox comprising all the necessary functionalities for multivariate analyses of neuroimaging data, based on machine learning models. The "Pattern Recognition for Neuroimaging Toolbox" (PRoNTo) is open-source, cross-platform, MATLAB-based and SPM compatible, therefore being suitable for both cognitive and clinical neuroscience research. In addition, it is designed to facilitate novel contributions from developers, aiming to improve the interaction between the neuroimaging and machine learning communities. Here, we introduce PRoNTo by presenting examples of possible research questions that can be addressed with the machine learning framework implemented in PRoNTo, and cannot be easily investigated with mass univariate statistical analysis.


Figures

Fig. 1
Fig. 1
PRoNTo framework. PRoNTo has five main analysis modules (blue boxes in the centre): dataset specification, feature set selection, model specification, model estimation and weights computation. In addition, it provides two main reviewing and displaying facilities (model, kernel and cross-validation displays, as well as, results display). PRoNTo receives as input any NIfTI images (comprising the data and a first-level mask, while an optional second-level mask can also be entered). In addition, when the dataset being analyzed comprises an experimental design, PRoNTo provides more than one way of specifying the design parameters, including loading an SPM.mat file. The outputs of PRoNTo include: a data structure called PRT.mat, a data matrix (with all features), one or more kernels, and (optionally) images with the classifier weights
Fig. 2
Fig. 2
Feature set (left), cross-validation scheme (middle) and kernel (right) used in Question 1. The feature set consisted of a single data modality from a single subject in a single group but with 9 conditions (8 objects + rest) randomly repeated 12 times. Scan and block index, as well as stimulus type are colorcoded in the left plot. Here the blocks correspond to the chunks into which the data were split in order to build the data matrix file (please consult PRoNTo’s manual for more information) and avoid memory problems. To classify the visual stimuli presented to the subject (faces or houses) we used a leave one run out cross-validation scheme. As can be see, this results in 12 folds (corresponding to the twelve experimental runs). Since only the ‘faces’ and ‘houses’ are used in the classification most of the images are not used (in white) in the training (grey) and testing (black). The kernel was constructed using all scans (1452 in total), and therefore is a 1452 × 1452 matrix
Fig. 3
Fig. 3
Model weights obtained with GP using the whole-brain mask (a) and model weights obtained with SVM using the whole brain (b), visual areas (c) and fusiform gyrus (d) masks. These weights are for the block design fMRI single-subject dataset. The discrimination task involved classifying the category (faces versus houses) of the object seen by the subject
Fig. 4
Fig. 4
Plot types provided in PRoNTo for classification approaches. Together with the model weights, PRoNTo allows the user to plot: the prediction values (per fold), histograms of the function values for each class, Receiver-Operating Characteristic Curves (ROC) and 3D confusion matrices. All of these plots are available for each model and cross-validation fold (including average of all folds), and were here plotted for SVM using the visual cortex mask
Fig. 5
Fig. 5
HRF correction. On the left is the standard HRF response. On the right is the effect of the delay and overlap on the number of independent scans (C1, C2 and C3 correspond to three different experimental conditions and the blue boxes correspond to various scans acquired during each condition). In fMRI datasets, the nature of the HRF (i.e. being a delayed and dispersed version of the neuronal response to an experimental event) might lead to less independent scans/events than the ones originally acquired. In PRoNTo, this issue is accounted for by discarding overlapping scans in terms of BOLD signal
Fig. 6
Fig. 6
Classifier accuracy as a function of the HRF parameters. We varied the HRF parameters (overlap and delay) between 0 and 15 s and plotted the accuracy of SVM in discriminating between famous and non-famous faces on a prime repetition event-related single subject fMRI dataset
Fig. 7
Fig. 7
Whole-brain model weights obtained with SVM using the beta images (GLM coefficients) instead of the preprocessed BOLD signal for the famous versus non-famous faces dataset
Fig. 8
Fig. 8
Subset of the IXI dataset chosen for further analysis. It comprises data from young (20–30) and old (60–90) healthy subjects, which were acquired in three different centers (c1, c2 and c3)
Fig. 9
Fig. 9
Negative log marginal likelihood for the GP models based on scalar momentum and divergences. X-axis: folds. Y-axis: negative log marginal likelihood (NLML) of the GP model based on divergences (in red) and scalar momentum (in blue). For all folds, the NLML values are larger for divergences than for scalar momentum suggesting that the scalar momentum based GP model is more plausible than the divergences based GP model
Fig. 10
Fig. 10
Scatter plot of the probabilities of the scalar momentum based GP binary classifier with the age of the corresponding subject. This plot shows that no linear relationship could be derived from those values
Fig. 11
Fig. 11
Confusion matrix obtained from the multiclass GP model to distinguish between centers. The diagonals show the largest numbers (by far), which reveals an almost perfect classification of the centers

References

    1. Ashburner J, Friston KJ. Voxel-based morphometry—The methods. NeuroImage. 2000;11(6):805–821. doi: 10.1006/nimg.2000.0582. - DOI - PubMed
    1. Ashburner J, Friston KJ. Unified segmentation. NeuroImage. 2005;26:839–851. doi: 10.1016/j.neuroimage.2005.02.018. - DOI - PubMed
    1. Ashburner J, Friston KJ. Computing average shaped tissue probability templates. NeuroImage. 2009;45:333–341. doi: 10.1016/j.neuroimage.2008.12.008. - DOI - PubMed
    1. Ashburner J, Friston KJ. Diffeomorphic registration using geodesic shooting and Gauss-Newton optimisation. NeuroImage. 2011;55:954–967. doi: 10.1016/j.neuroimage.2010.12.049. - DOI - PMC - PubMed
    1. Bishop, C. (2006). Pattern recognition and machine learning. Springer.

Publication types