. 2013 Apr 26;288(17):11771-85.
doi: 10.1074/jbc.M112.448126. Epub 2013 Feb 15.

Structure and interactions of the human programmed cell death 1 receptor

Affiliations

Structure and interactions of the human programmed cell death 1 receptor

Xiaoxiao Cheng et al. J Biol Chem. .

Abstract

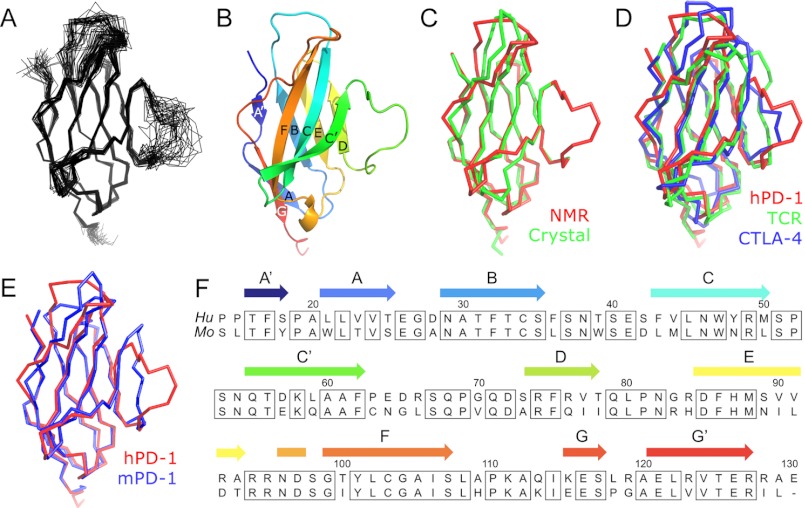
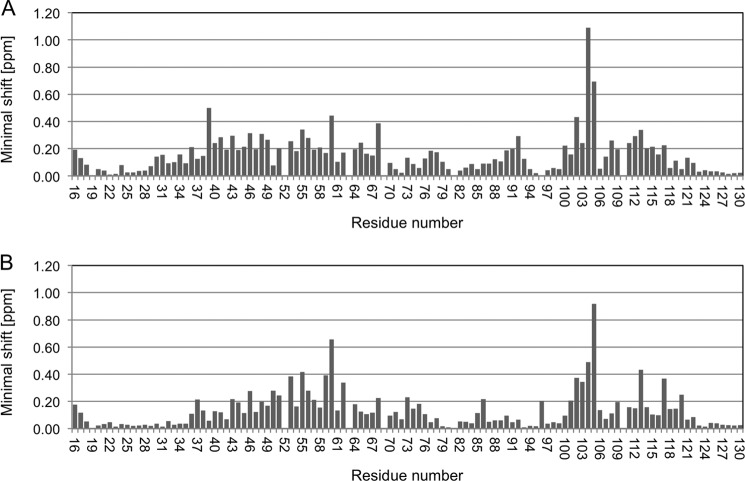
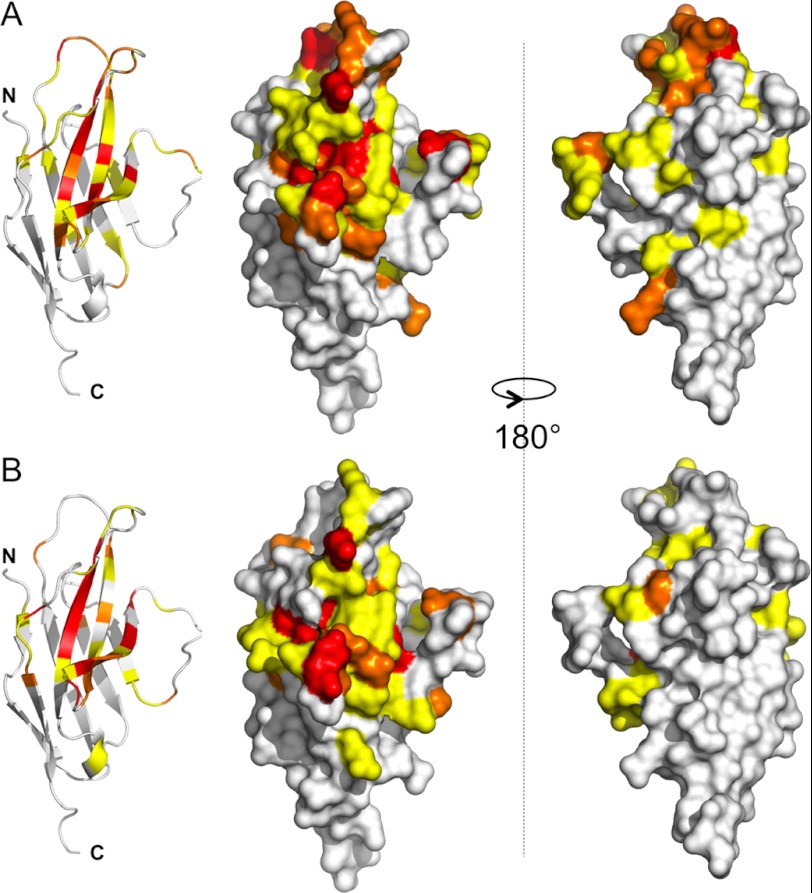
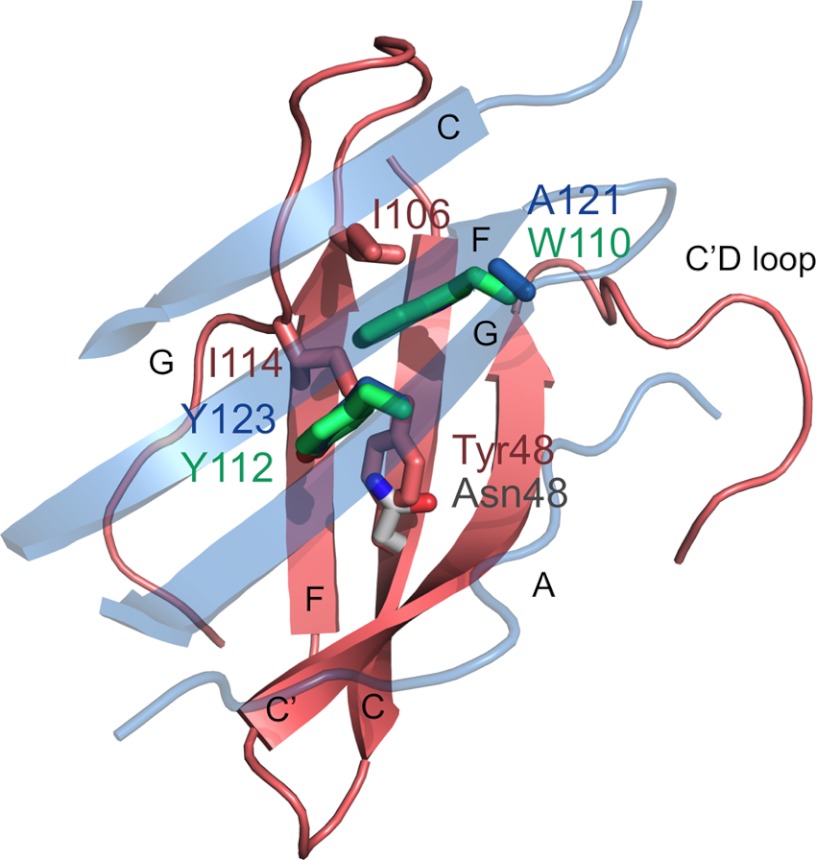
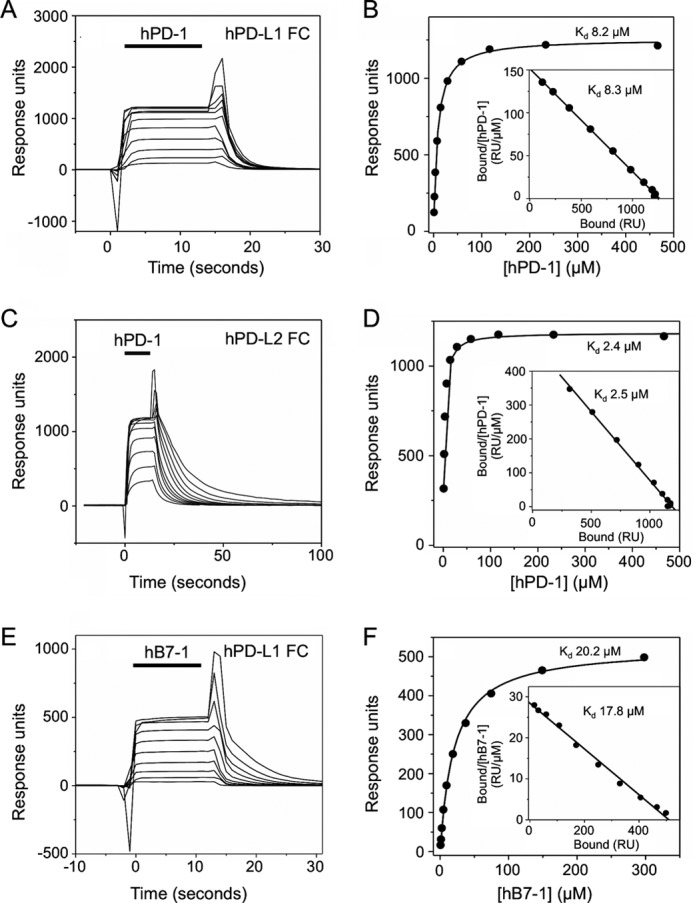
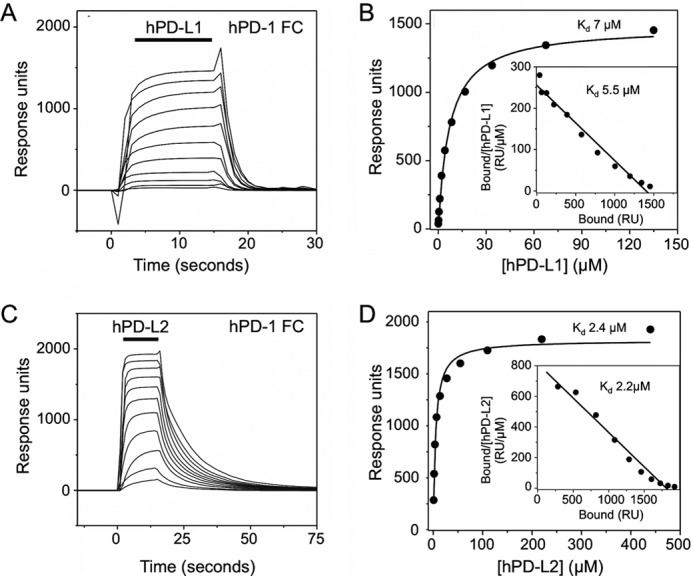
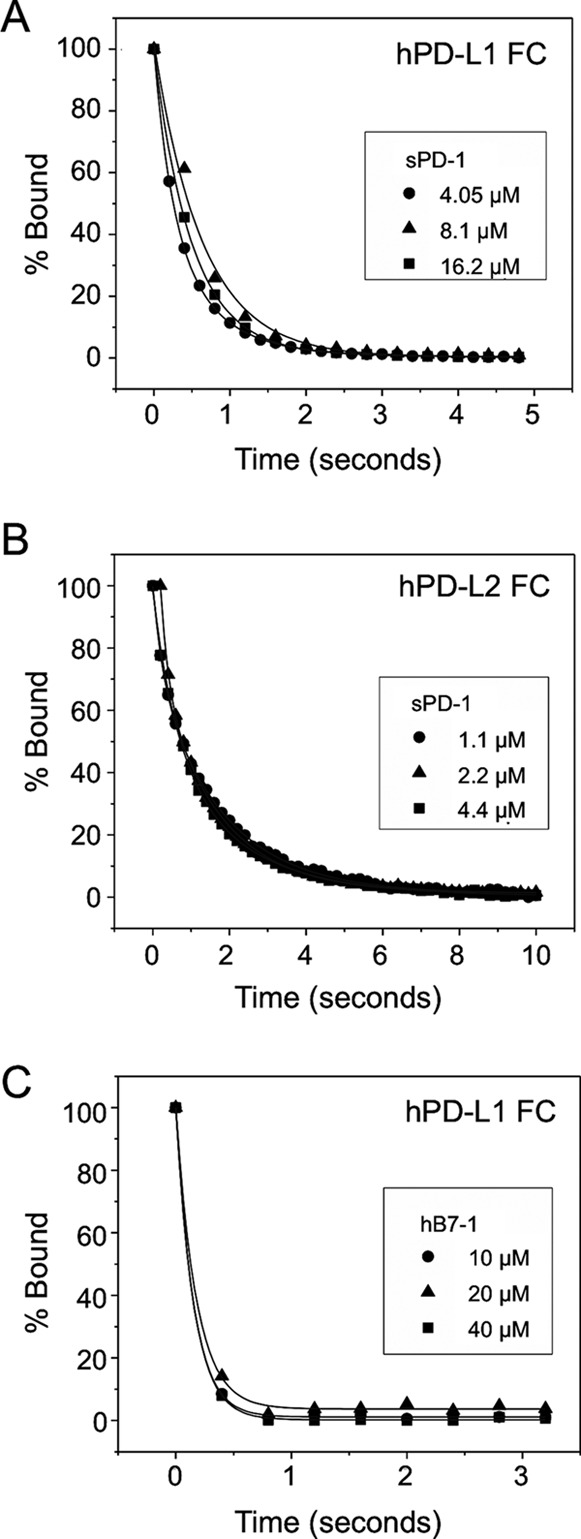
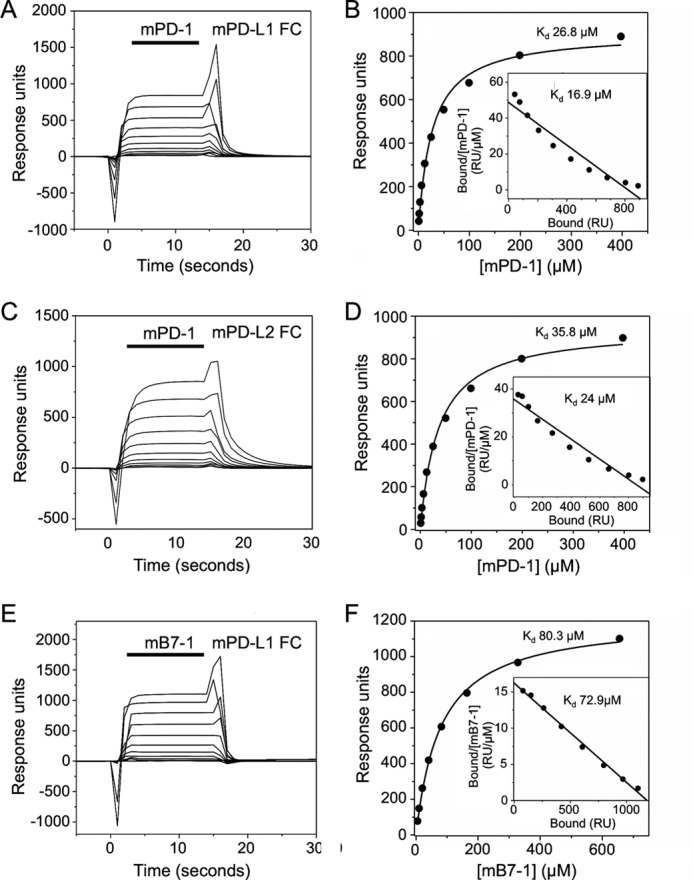
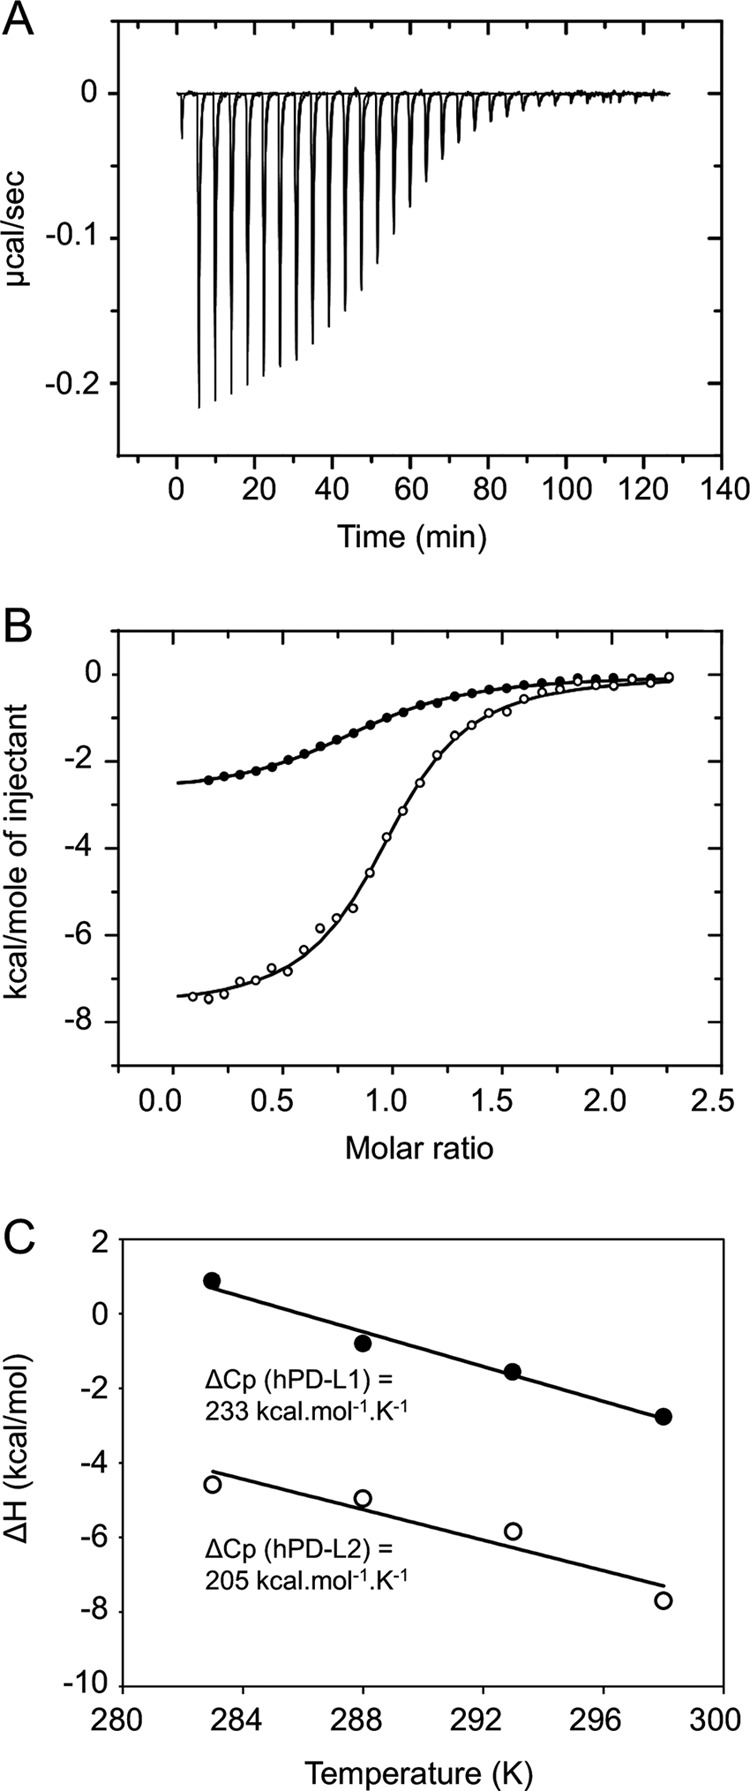
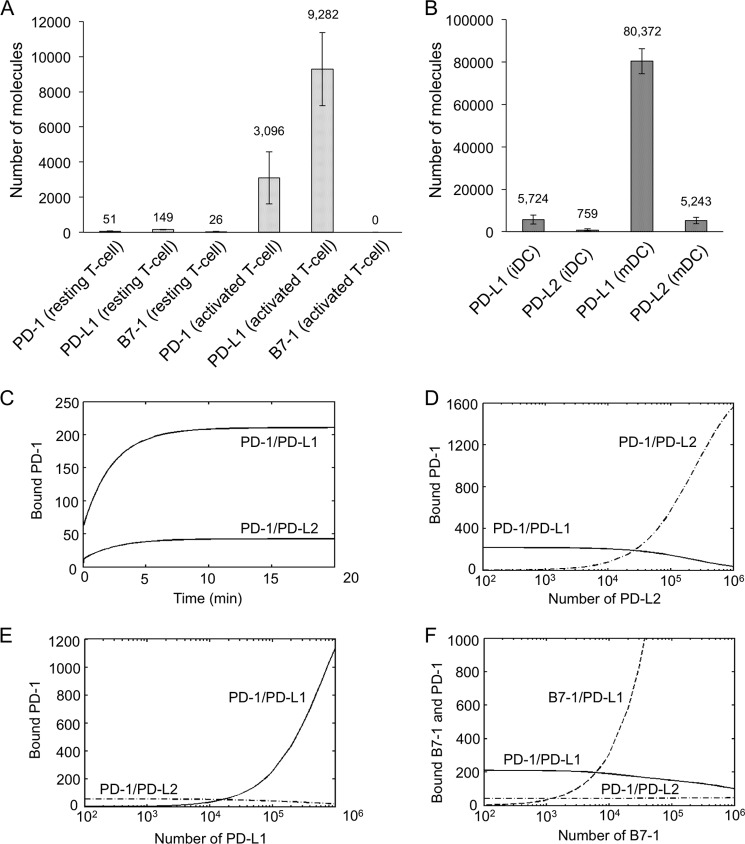
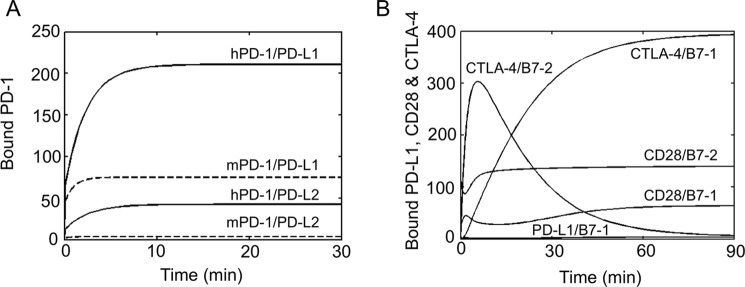
PD-1, a receptor expressed by T cells, B cells, and monocytes, is a potent regulator of immune responses and a promising therapeutic target. The structure and interactions of human PD-1 are, however, incompletely characterized. We present the solution nuclear magnetic resonance (NMR)-based structure of the human PD-1 extracellular region and detailed analyses of its interactions with its ligands, PD-L1 and PD-L2. PD-1 has typical immunoglobulin superfamily topology but differs at the edge of the GFCC' sheet, which is flexible and completely lacks a C" strand. Changes in PD-1 backbone NMR signals induced by ligand binding suggest that, whereas binding is centered on the GFCC' sheet, PD-1 is engaged by its two ligands differently and in ways incompletely explained by crystal structures of mouse PD-1 · ligand complexes. The affinities of these interactions and that of PD-L1 with the costimulatory protein B7-1, measured using surface plasmon resonance, are significantly weaker than expected. The 3-4-fold greater affinity of PD-L2 versus PD-L1 for human PD-1 is principally due to the 3-fold smaller dissociation rate for PD-L2 binding. Isothermal titration calorimetry revealed that the PD-1/PD-L1 interaction is entropically driven, whereas PD-1/PD-L2 binding has a large enthalpic component. Mathematical simulations based on the biophysical data and quantitative expression data suggest an unexpectedly limited contribution of PD-L2 to PD-1 ligation during interactions of activated T cells with antigen-presenting cells. These findings provide a rigorous structural and biophysical framework for interpreting the important functions of PD-1 and reveal that potent inhibitory signaling can be initiated by weakly interacting receptors.


Figures

FIGURE 1.
FIGURE 1.
Solution structure of the extracellular domain of human PD-1. A, best fit superposition of the protein backbone for the 35 converged structures obtained for hPD-1. B, ribbon representation of the backbone topology of the structure closest to the mean, in the same orientation. C, comparison of the NMR-based (red) and crystal (green; PDB accession number 3RRQ) structures of hPD-1. D, comparison of the structures of hPD-1, TCRδ V-domain (PDB accession number 3OMZ), and CTLA-4 (PDB accession number 3OSK). E, comparison of the backbone topologies of human (red) and mouse (PDB accession number 1NPU; blue) PD-1. F, structure-based alignment of the sequences of human (Hu) and mouse (Mo) PD-1 (mature polypeptide numbering).
FIGURE 2.
FIGURE 2.
Minimal backbone chemical shift (15N, 13C′, and 1HN) change values observed for hPD-1 on hPD-L1 (A) or hPD-L2 (B) binding. The values were obtained by comparison of three-dimensional TROSY-HNCO spectra of the samples consisting of the free or hPD-L1/hPD-L2-bound 2H/13C/15N-labeled hPD-1.
FIGURE 3.
FIGURE 3.
Regions of hPD-1 affected by PD-L1/PD-L2 binding. A, schematic and surface views of hPD-1 in which residues are colored according to the perturbation of their backbone (15N, 13C′, and 1HN) signals induced by hPD-L1 binding. Residues highlighted in B indicate the areas in hPD-1 affected by hPD-L2 binding. The color scheme used is relative for each complex (residues with minimal shift values lower than the S.D. value for the whole set are represented in white, residues with minimal shift values of >1 × S.D. are shown in yellow, residues with minimal shift values of >1.5 × S.D. are shown in orange, and residues with minimal shift values of >2 × S.D. are in red). Two views rotated by 180° are shown.
FIGURE 4.
FIGURE 4.
Portions of modeled or actual complexes of hPD-1 (red) and mPD-1 (gray), complexed with hPD-L1 (blue) and mPD-L2 (green). Only the GFCC′ strands and extended C′D loop of hPD-1 and the AGFC strands of hPD-L1 are shown. hPD-1 (red), mPD-1 (gray), hPD-L1 (blue), and mPD-L2 (green) residues for which the model or actual complexes appear to be inconsistent with the levels of perturbation of the hPD-1 backbone signals in the presence of the ligands are shown in stick format (see “Results” for details).
FIGURE 5.
FIGURE 5.
Human PD-1/PD-1 ligand and hPD-L1/B7-1 interactions (equilibrium binding analyses). A, hPD-1, at a range of concentrations (930 μm and 2-fold dilutions thereof), was injected at 20 μl/min sequentially (solid bar) through a flow cell containing ∼2000 RU of indirectly immobilized hPD-L1 at 37 °C. Background responses observed in a control flow cell containing immobilized hCD4 were subtracted from the total responses to give binding. B, nonlinear curve fitting of the untransformed data using a 1:1 Langmuir binding isotherm yielded a Kd of 8.2 μm and a binding maximum of 1257 RU. A linear Scatchard plot of the hPD-1/hPD-L1 binding data (inset) yielded a similar Kd of 8.3 μm. C, hPD-1, at a range of concentrations (930 μm and 2-fold dilutions thereof), was injected as in A through a flow cell containing ∼2000 RU of indirectly immobilized hPD-L2 at 37 °C. Background responses have been subtracted. D, nonlinear curve fitting of the untransformed data using a 1:1 Langmuir binding isotherm yielded a Kd of 2.4 μm and a binding maximum of 1185 RU. A linear Scatchard plot of the hPD-1/hPD-L2 binding data (inset) yielded a similar Kd of 2.5 μm. E, hB7-1, at a range of concentrations (596 μm and 2-fold dilutions thereof), was injected as in A through a flow cell containing ∼2000 RU of indirectly immobilized hPD-L1 at 37 °C. Background responses have been subtracted. F, nonlinear curve fitting of the untransformed data using a 1:1 Langmuir binding isotherm yielded a Kd of 20.2 μm and a binding maximum of 525 RU. A linear Scatchard plot of the hB7-1/hPD-L1 binding data (inset) yielded a similar Kd of 17.8 μm.
FIGURE 6.
FIGURE 6.
hPD-1/hPD-L1 equilibrium binding analyses (reverse orientation). A, hPD-L1, at a range of concentrations (135 μm and 2-fold dilutions thereof) was injected at 20 μl/min sequentially (solid bar) through a flow cell containing ∼4000 RU of directly immobilized hPD-1Fc at 37 °C. Background responses observed in a control flow cell containing immobilized hCD28Fc were subtracted from the total responses to give binding. B, nonlinear curve fitting of the untransformed data using a 1:1 Langmuir binding isotherm yielded a Kd of 7.0 μm and a binding maximum of 1480 RU. A linear Scatchard plot of the hPD-1/hPD-L1 binding data (inset) yielded a similar Kd of 5.5 μm. C, hPD-L2, at a range of concentrations (220 μm and 2-fold dilutions thereof), was injected as in A through a flow cell containing ∼5000 RU of directly immobilized hPD-1Fc at 37 °C. Background responses have been subtracted. D, nonlinear curve fitting of the untransformed data using a 1:1 Langmuir binding isotherm yielded a Kd of 2.4 μm and a binding maximum of 1822 RU. A linear Scatchard plot of the hPD-1/hPD-L2 binding data (inset) yielded a similar Kd of 2.2 μm.
FIGURE 7.
FIGURE 7.
Kinetic analyses. A, hPD-1, at concentrations of 4.05, 8.1, and 16.2 μm, was injected at 100 μl/min at 37 °C over ∼250 RU of indirectly immobilized hPD-L1 and allowed to dissociate at the end of each injection. Data were recorded at the maximal collection rate (10 Hz) until the response had returned to base line. Responses in a control flow cell were subtracted, and the remaining binding was plotted as a percentage of initial binding. The data are fitted with single exponential decay curves, giving a koff value of 1.97 ± 0.19 s−1 (mean ± S.D., n = 9). B, dissociation of hPD-1 from hPD-L2 at 37 °C. hPD-1 (1.1, 2.2, and 4.4 μm) was injected over ∼100 RU of indirectly immobilized hPD-L2 at 100 μl/min. The data are fitted with single exponential decay curves, giving a koff value of 0.71 ± 0.07 s−1 (mean ± S.D., n = 9). C, dissociation of hB7-1 from hPD-L1 at 37 °C. hB7-1 (10, 20, and 40 μm) was injected over ∼350 RU of indirectly immobilized hPD-L1 at 100 μl/min. The data are fitted with single exponential decay curves, giving a koff value of 6.44 ± 0.38 s−1 (mean ± S.D., n = 9).
FIGURE 8.
FIGURE 8.
Murine PD-1/PD-L1 interactions (equilibrium binding analyses). A, mPD-1, at a range of concentrations (398 μm and 2-fold dilutions thereof) was injected at 20 μl/min sequentially (solid bar) through a flow cell containing ∼2000 RU of indirectly immobilized mPD-L1 at 37 °C. Background responses observed in a control flow cell containing immobilized hCD4 were subtracted from the total responses to give binding. B, nonlinear curve fitting of the untransformed data using a 1:1 Langmuir binding isotherm yielded a Kd of 26.8 μm and a binding maximum of 908 RU. A Scatchard plot of the mPD-1/mPD-L1 binding data (inset) yielded a Kd of 16.9 μm. C, mPD-1, at a range of concentrations (398 μm and 2-fold dilutions thereof) was injected as in A through a flow cell containing ∼2000 RU of indirectly immobilized mPD-L2 at 37 °C. Background responses have been subtracted. D, nonlinear curve fitting of the untransformed data using a 1:1 Langmuir binding isotherm yielded a Kd of 35.8 μm and a binding maximum of 946 RU. A Scatchard plot of the mPD-1/mPD-L2 binding data (inset) yielded a Kd of 24 μm. E, mB7-1, at a range of concentrations (655 μm and 2-fold dilutions thereof) was injected as in A through a flow cell containing ∼2000 RU of indirectly immobilized mPD-L1 at 37 °C. Background responses have been subtracted. F, nonlinear curve fitting of the untransformed data using a 1:1 Langmuir binding isotherm yielded a Kd of 80.3 μm and a binding maximum of 1215 RU. A Scatchard plot of the mB7-1/mPD-L1 binding data (inset) yielded a similar Kd of 72.9 μm.
FIGURE 9.
FIGURE 9.
ITC measurements of hPD-1 binding to PD-L1 and PD-L2. A, example of raw data for titration of hPD-L2 at 0.2 mm into an isothermal calorimetry cell containing a 0.02 mm solution of hPD-1Fc at pH 7.4 and 25 °C in a buffer containing 150 mm NaCl. Similar titrations were undertaken at various temperatures, the results of which are summarized in Table 3. B, plots of heat-released versus molar ratio for the interactions of hPD-L1 (closed circles) and hPD-L2 (open circles) with hPD-1. C, plots of observed enthalpy versus temperature for the interactions of hPD-L1 (closed circles) and hPD-L2 (open circles) with hPD-1. The slopes of these plots give the change in heat capacity (ΔCp) upon binding of hPD-L1 and hPD-L2 to hPD-1, the values of which are −233 and −205 cal mol−1 K−1, respectively.
FIGURE 10.
FIGURE 10.
Simulations of human PD-1/ligand and PD-L1/B7-1 interactions based on affinity and expression data. A, the expression levels of human PD-1, PD-L1, and B7-1 on resting and activated human T cells. Peripheral blood mononuclear cells were activated with PHA (50 μg/ml) for 2 days. Cells were stained with PE-conjugated mAbs for each protein and analyzed by flow cytometry. QuantiBRITE PE beads were analyzed alongside the stained peripheral blood mononuclear cell samples. The experiments were done in duplicate. The average of two sets of data is shown; the error bars indicate S.D. B, expression levels for PD-L1 and PD-L2 on immature DCs and mature DCs. DCs were derived by using GM-CSF (50 ng/ml) and IL-4 (50 ng/ml) for 6 days. CD14+ monocytes were initially isolated from human peripheral blood mononuclear cells using CD14 MACs beads (Miltenyi Biotec). Immature DCs were then stimulated with LPS (1 μg/ml) for 24 h to obtain mature DCs. Cells were stained with PE-conjugated mAbs for each protein and analyzed by flow cytometry. The experiments were done in duplicate. The average of two sets of data are shown; error bars indicate S.D. C–F, simulations of molecular complex formation at the synaptic interface between an activated T cell and a mature DC. C, numbers of bound PD-1 molecules over time. D and E, number of bound PD-1 molecules at steady state as a function of varying the number of PD-L2 or PD-L1 molecules on the DC. F, number of bound PD-1 and B7-1 molecules at steady state as a function of varying the number of B7-1 molecules on the T cell.
FIGURE 11.
FIGURE 11.
Simulations of murine PD-1/ligand interactions and effects of PD-L1/B7-1 interactions on CD28 and CTLA-4 ligation. A, number of bound PD-1 molecules over time. The simulations are based on human Kd values (solid lines) and on mouse Kd values (dashed lines) obtained in the present study. The expression values and off-rates obtained for human PD-1 and its ligands are used in both simulations because the corresponding mouse data are not available. B, number of bound PD-L1, CD28, and CTLA-4 as a function of time. The effect of PD-L1 on the CD28 and CTLA-4 ligation to their B7 ligands was simulated by incorporating the interaction between PD-L1 and B7-1 in our previous model of the costimulatory system (50). Because PD-L1 only binds to a few B7-1 molecules, PD-L1 expression barely affects CD28 and CTLA-4 ligation.

References

    1. Nishimura H., Nose M., Hiai H., Minato N., Honjo T. (1999) Development of lupus-like autoimmune diseases by disruption of the PD-1 gene encoding an ITIM motif-carrying immunoreceptor. Immunity 11, 141–151 - PubMed
    1. Nishimura H., Okazaki T., Tanaka Y., Nakatani K., Hara M., Matsumori A., Sasayama S., Mizoguchi A., Hiai H., Minato N., Honjo T. (2001) Autoimmune dilated cardiomyopathy in PD-1 receptor-deficient mice. Science 291, 319–322 - PubMed
    1. Ferreiros-Vidal I., Gomez-Reino J. J., Barros F., Carracedo A., Carreira P., Gonzalez-Escribano F., Liz M., Martin J., Ordi J., Vicario J. L., Gonzalez A. (2004) Association of PDCD1 with susceptibility to systemic lupus erythematosus. Evidence of population-specific effects. Arthritis Rheum. 50, 2590–2597 - PubMed
    1. James E. S., Harney S., Wordsworth B. P., Cookson W. O., Davis S. J., Moffatt M. F. (2005) PDCD1. A tissue-specific susceptibility locus for inherited inflammatory disorders. Genes Immun. 6, 430–437 - PubMed
    1. Kong E. K., Prokunina-Olsson L., Wong W. H., Lau C. S., Chan T. M., Alarcón-Riquelme M., Lau Y. L. (2005) A new haplotype of PDCD1 is associated with rheumatoid arthritis in Hong Kong Chinese. Arthritis Rheum. 52, 1058–1062 - PubMed

MeSH terms