

QTL-based association analyses reveal novel genes influencing pleiotropy of metabolic syndrome (MetS)
- PMID: 23418049
- PMCID: PMC3769476
- DOI: 10.1002/oby.20324
QTL-based association analyses reveal novel genes influencing pleiotropy of metabolic syndrome (MetS)
Abstract
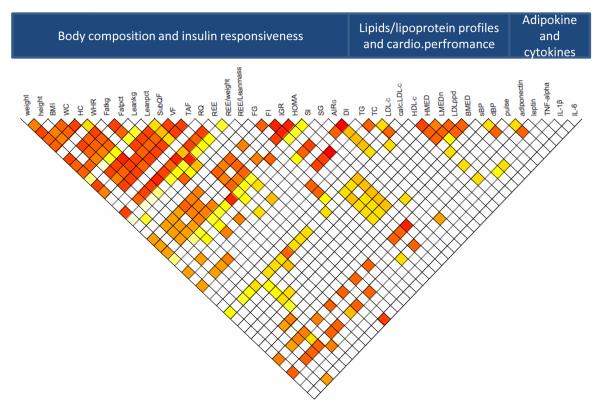
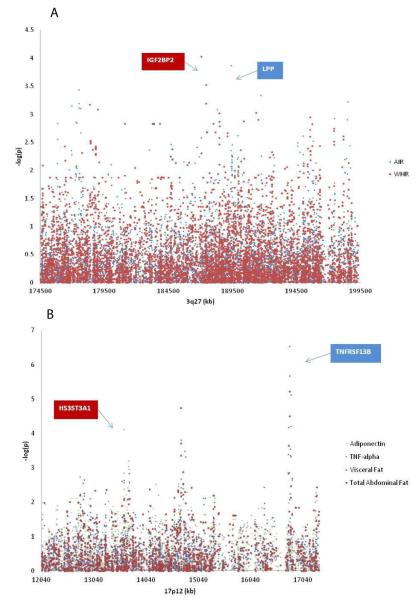
Objective: Metabolic Syndrome (MetS) is a phenotype cluster predisposing to type 2 diabetes and cardiovascular disease. We conducted a study to elucidate the genetic basis underlying linkage signals for multiple representative traits of MetS that we had previously identified at two significant QTLs on chromosomes 3q27 and 17p12.
Design and methods: We performed QTL-specific genomic and transcriptomic analyses in 1,137 individuals from 85 extended families that contributed to the original linkage. We tested in SOLAR association of MetS phenotypes with QTL-specific haplotype-tagging SNPs as well as transcriptional profiles of peripheral blood mononuclear cells (PBMCs).
Results: SNPs significantly associated with MetS phenotypes under the prior hypothesis of linkage mapped to seven genes at 3q27 and seven at 17p12. Prioritization based on biologic relevance, SNP association, and expression analyses identified two genes: insulin-like growth factor 2 mRNA-binding protein 2 (IGF2BP2) at 3q27 and tumor necrosis factor receptor 13B (TNFRSF13B) at 17p12. Prioritized genes could influence cell-cell adhesion and adipocyte differentiation, insulin/glucose responsiveness, cytokine effectiveness, plasma lipid levels, and lipoprotein densities.
Conclusions: Using an approach combining genomic, transcriptomic, and bioinformatic data we identified novel candidate genes for MetS.
Copyright © 2013 The Obesity Society.
Figures
References
-
- Hetherington MM, Cecil JE. Gene-environment interactions in obesity. Forum Nutr: 2010;63:195–203. - PubMed
-
- Catenacci VA, Hill JO, Wyatt HR. The obesity epidemic. Clin Chest Med. 2009;30(3):415–44. vii. - PubMed
-
- Day C. Metabolic syndrome, or What you will: definitions and epidemiology. Diab Vasc Dis Res. 2007 Mar;4(1):32–38. - PubMed
-
- Gibson F, Froguel P. Genetics of the APM1 locus and its contribution to type 2 diabetes susceptibility in French Caucasians. Diabetes. 2004;53(11):2977–2983. - PubMed
Publication types
MeSH terms
Substances
Grants and funding
LinkOut - more resources
Full Text Sources
Other Literature Sources
Medical
