. 2013;8(2):e55944.
doi: 10.1371/journal.pone.0055944. Epub 2013 Feb 13.

Spread of academic success in a high school social network

Affiliations

Spread of academic success in a high school social network

Deanna Blansky et al. PLoS One. 2013.

Abstract

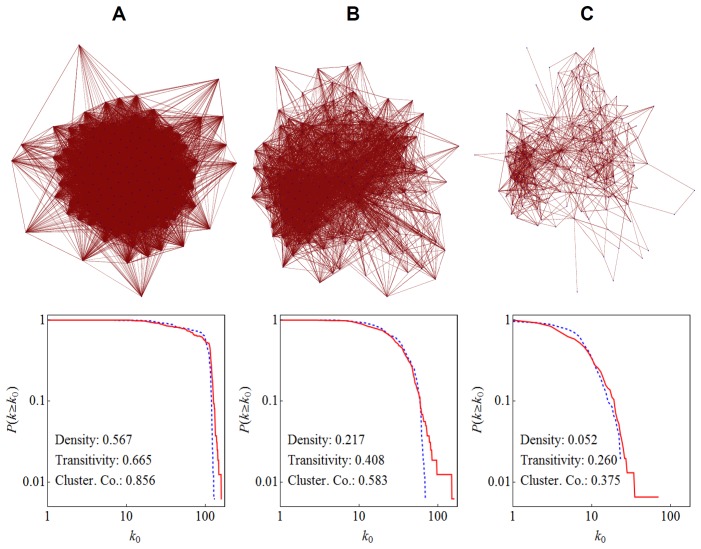
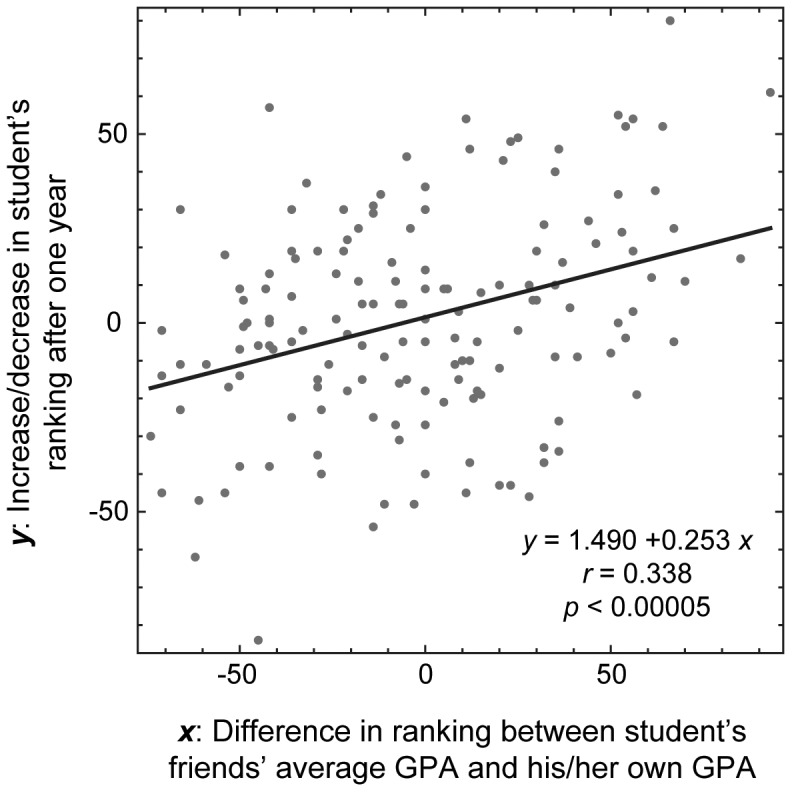
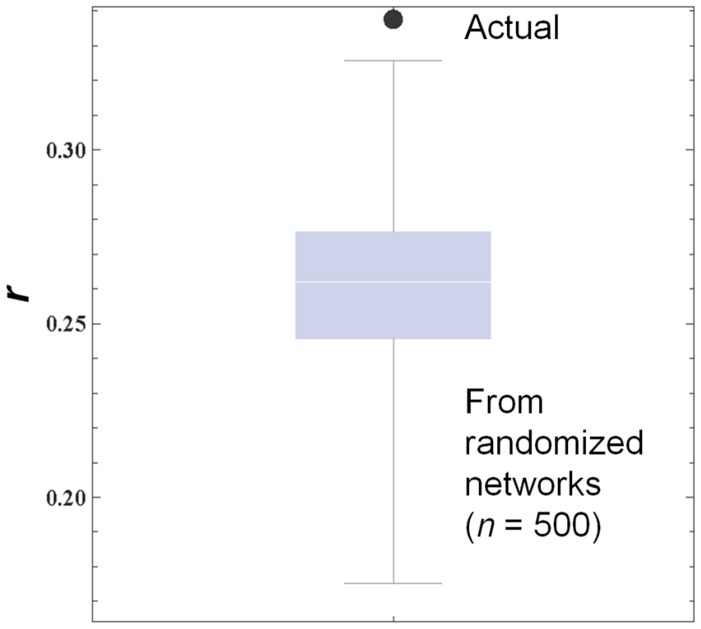
Application of social network analysis to education has revealed how social network positions of K-12 students correlate with their behavior and academic achievements. However, no study has been conducted on how their social network influences their academic progress over time. Here we investigated correlations between high school students' academic progress over one year and the social environment that surrounds them in their friendship network. We found that students whose friends' average GPA (Grade Point Average) was greater (or less) than their own had a higher tendency toward increasing (or decreasing) their academic ranking over time, indicating social contagion of academic success taking place in their social network.


Conflict of interest statement

Competing Interests: The authors have declared that no competing interests exist.

Figures

Figure 1
Figure 1. The social network in the junior class of Maine-Endwell High School at three different levels.
Top: Visualizations of networks. Nodes (blue dots) represent individual students. Links (thin red lines) represent their friendships reconstructed from results of the online survey administered in January 2011. Directions of links are omitted for clarity. These plots show the entire network (i.e., there were no disconnected nodes or components in our data). Bottom: Complementary cumulative degree distributions and other network metrics. Red solid lines are for out-degrees, while blue dashed lines for in-degrees. Densities and transitivities were calculated using directed links, while average clustering coefficients were calculated after converting all the links into undirected ones. (A) A network made of all levels of links (acquaintances, friends, and best or close friends). (B) A network made of links for friends and best or close friends only. (C) A network made of best or close friends only.
Figure 2
Figure 2. Positive correlation between the social network environment and the student’s academic progress over one year.
The horizontal axis represents the difference in ranking between a student’s friends’ average GPA and his/her own GPA (x = x friend). The vertical axis represents the increase/decrease in the student’s ranking after one year (y). Each dot represents data from one student.
Figure 3
Figure 3. Comparison of Pearson’s correlation coefficients (r) between actual and simulated cases.
A large dot shows the actual correlation coefficient observed in Figure 2, while the box-whisker plot shows the distribution of simulated correlation coefficients calculated on randomized network topologies in which the out-degrees of individual nodes were all fixed.

References

    1. Wasserman S, Faust K (1994) Social Network Analysis: Methods and Applications. Cambridge, UK: Cambridge University Press. 857 p.
    1. Farmer TW, Rodkin PC (1996) Antisocial and prosocial correlates of classroom social positions: the social network centrality perspective. Social Development 5: 174–188.
    1. Bishop N (2009) The relation between peer group grades, social network structure, and secondary school academic achievement. Paper presented at the 2009 Annual Meeting of the American Sociological Association. Available: http://www.allacademic.com/meta/p308630_index.html. Accessed 31 August 2012.
    1. Add Health Data (1994-) Available: http://www.cpc.unc.edu/projects/addhealth/data. Accessed 31 Aug 2012.
    1. Fryer RG, Torelli P (2010) An empirical analysis of ‘acting white’. J Public Econ 94: 380–396.

Publication types

LinkOut - more resources