Use of sodium-chloride difference and corrected anion gap as surrogates of Stewart variables in critically ill patients
- PMID: 23418590
- PMCID: PMC3572048
- DOI: 10.1371/journal.pone.0056635
Use of sodium-chloride difference and corrected anion gap as surrogates of Stewart variables in critically ill patients
Abstract
Introduction: To investigate whether the difference between sodium and chloride ([Na(+)] - [Cl(-)]) and anion gap corrected for albumin and lactate (AG(corr)) could be used as apparent strong ion difference (SID(app)) and strong ion gap (SIG) surrogates (respectively) in critically ill patients.
Methods: A total of 341 patients were prospectively observed; 161 were allocated to the modeling group, and 180 to the validation group. Simple regression analysis was used to construct a mathematical model between SID(app) and [Na(+)] - [Cl(-)] and between SIG and AG(corr) in the modeling group. Area under the receiver operating characteristic (ROC) curve was also measured. The mathematical models were tested in the validation group.
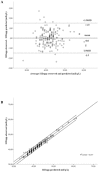
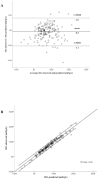
Results: in the modeling group, SID(app) and SIG were well predicted by [Na(+)] - [Cl(-)] and AG(corr) (R(2) = 0.973 and 0.96, respectively). Accuracy values of [Na(+)] - [Cl(-)] for the identification of SID(app) acidosis (<42.7 mEq/L) and alkalosis (>47.5 mEq/L) were 0.992 (95% confidence interval [CI], 0.963-1) and 0.998 (95%CI, 0.972-1), respectively. The accuracy of AG(corr) in revealing SIG acidosis (>8 mEq/L) was 0.974 (95%CI: 0.936-0.993). These results were validated by showing excellent correlations and good agreements between predicted and measured SID(app) and between predicted and measured SIG in the validation group (R(2) = 0.977; bias = 0±1.5 mEq/L and R(2) = 0.96; bias = -0.2±1.8 mEq/L, respectively).
Conclusions: SID(app) and SIG can be substituted by [Na(+)] - [Cl(-)] and by AG(corr) respectively in the diagnosis and management of acid-base disorders in critically ill patients.
Conflict of interest statement
Figures


References
-
- Gunnerson KJ, Kellum JA (2003) Aid-Base and electrolyte analysis in critically ill patients: are we ready for the new millennium? Curr Opin Crit Care 9: 468–473. - PubMed
-
- Gauthier PM, Szerlip HM (2002) Metabolic acidosis in the intensive care unit. Crit Care Clin 18: 289–308. - PubMed
-
- Henderson LJ (1908) The theory of neutrality regulation in the animal organism. Am J Physiol 21: 427–428.
-
- Van Slyke DD, Wu H, McLean FC (1923) Studies of gas and electrolyte equilibria in the blood. V. Factors controlling the electrolyte and water distribution in the blood. J Biol Chem 56: 765–849.
-
- Astrup P (1956) A simple electrometric technique for the determination of carbon dioxide tension in blood and plasma, total content of carbon dioxide in plasma, and bicarbonate content in ‘separated’ plasma at a fixed carbon dioxide tension (40 mmHg). Scand J Clin Lab Invest 8: 33–43. - PubMed
MeSH terms
Substances
LinkOut - more resources
Full Text Sources
Other Literature Sources
Miscellaneous

