. 2013 Aug;27(8):1659-65.
doi: 10.1038/leu.2013.52. Epub 2013 Feb 19.

Minimal residual disease quantification using consensus primers and high-throughput IGH sequencing predicts post-transplant relapse in chronic lymphocytic leukemia

Affiliations
Free PMC article

Minimal residual disease quantification using consensus primers and high-throughput IGH sequencing predicts post-transplant relapse in chronic lymphocytic leukemia

A C Logan et al. Leukemia. 2013 Aug.
Free PMC article

Abstract

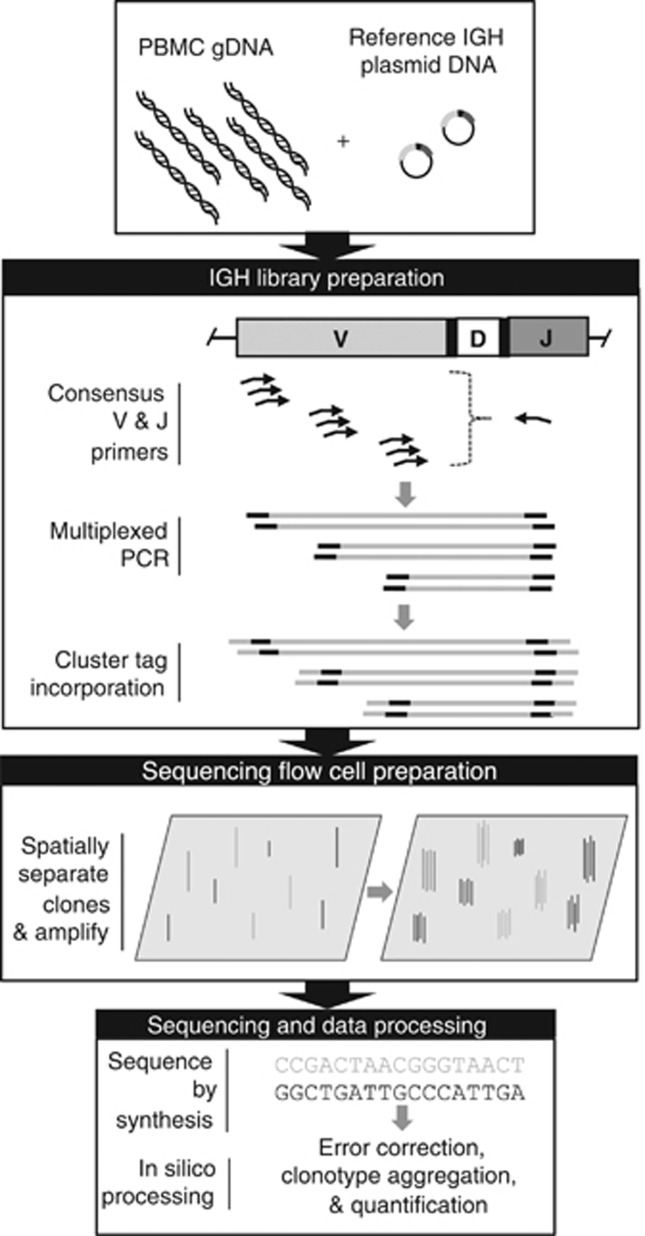
Quantification of minimal residual disease (MRD) following allogeneic hematopoietic cell transplantation (allo-HCT) predicts post-transplant relapse in patients with chronic lymphocytic leukemia (CLL). We utilized an MRD-quantification method that amplifies immunoglobulin heavy chain (IGH) loci using consensus V and J segment primers followed by high-throughput sequencing (HTS), enabling quantification with a detection limit of one CLL cell per million mononuclear cells. Using this IGH-HTS approach, we analyzed MRD patterns in over 400 samples from 40 CLL patients who underwent reduced-intensity allo-HCT. Nine patients relapsed within 12 months post-HCT. Of the 31 patients in remission at 12 months post-HCT, disease-free survival was 86% in patients with MRD <10(-4) and 20% in those with MRD ≥10(-4) (relapse hazard ratio (HR) 9.0; 95% confidence interval (CI) 2.5-32; P<0.0001), with median follow-up of 36 months. Additionally, MRD predicted relapse at other time points, including 9, 18 and 24 months post-HCT. MRD doubling time <12 months with disease burden ≥10(-5) was associated with relapse within 12 months of MRD assessment in 50% of patients, and within 24 months in 90% of patients. This IGH-HTS method may facilitate routine MRD quantification in clinical trials.


Figures

Figure 1
Figure 1
Overview of the LymphoSIGHT IGH–HTS method. PBMC genomic DNA (gDNA) was mixed with a set of reference IGH plasmids at known concentration. IGH alleles in this mixture were then amplified with consensus IGH V and J primers that append the annealing sites for secondary PCR primers. The PCR products from the first amplification were then amplified in a second PCR reaction using primers which append sample indices and cluster-formation sequences (cluster tag incorporation). These amplimers were then annealed to an Illumina Genome Analyzer-sequencing lane and locally amplified in situ via bridging PCR. Sequencing primers annealing to the second-round primer at each end of the IGH amplimers were used to sequence by synthesis the ends of paired strands. These data were then processed bioinformatically to map IGH V and J sequences to IMGT germline sequences, further analyzed to aggregate clonotypes to remove artifacts, and finally quantified.
Figure 2
Figure 2
LymphoSIGHT MRD quantification technical performance. (a) CLL cells were purified by fluorescence-activated cell sorting and then diluted into normal human PBMC with 10% B-cell content to levels of 10−3, 10−4, 10−5 and 10−6 CLL cells per leukocyte. DNA was harvested as described in the Patients and methods, and consensus PCR followed by Illumina HTS was performed in quadruplicate and processed bioinformatically for clonotype quantification. Quantifications of the diluted CLL clonotype in each mixture were performed and are graphed +/− s.e.m. (error bars) as a percentage of total IGH gene sequences. The number of CLL clonotypes expected to be recovered at each dilution are shown (dashed line). (b) Error frequencies in CLL clonotype reads in diagnostic samples are shown. (c) The quantification of CLL clonotypes in samples subjected to two entirely separate genomic DNA-to-sequence replicates from several patients are shown. The correlation between specific CLL clonotype quantification between replicate 1 and 2 was high (r=0.99). (d) The correlation between quantification of both IGH alleles in samples from five patients with biallelically rearranged CLL was high (r=0.97).
Figure 3
Figure 3
Correlation between IGH–HTS and ASO-PCR. Post-transplant PBMC or whole-blood samples were processed into DNA, and analyzed for MRD by IGH–HTS and ASO-PCR. The correlation between quantification of CLL clonotypes per one million leukocyte genomes using the two techniques was high (r=0.64; P<0.0001). Samples with <1 log differences in quantification using the two methods are shown between the dashed lines. Ninety-six percent of samples exhibited <1 log differences between the two assays (82% <0.5 log, 14% 0.5–1 log).
Figure 4
Figure 4
Twelve-month post-transplant landmark MRD analysis. Kaplan–Meier analysis of DFS is shown for 15 MRD-negative (<10−6) and 16 MRD-positive (⩾10−6) patients. The curves are significantly different (HR 7.9; 95% CI 2.3–26; P=0.0002).
Figure 5
Figure 5
Patterns of molecular disease progression associated with rapid clinical relapse. (a) To account for disease burden and rate of MRD change, disease burden is graphed against the slope (log2 used to improve visibility) of change at the time of sample collection. The patient from whom each sample was acquired is shown with a letter code (see Supplementary Table 1). Time intervals from sample acquisition to clinical relapse are depicted by graph symbol with intervals <6 months (squares), 6–12 months (diamonds), 12–24 months (circles) and >24 months (filled triangles) depicted. Samples from patients who maintained clinical remission are depicted by open triangles. The dashed line depicts an MRD progression slope of 2 (log2=1). (b) The percentage of patients who relapsed within 12 and 24 months of MRD doubling is shown for each level of disease burden.

References

    1. Gribben JG, O'Brien S. Update on therapy of chronic lymphocytic leukemia. J Clin Oncol. 2011;29:544–550. - PMC - PubMed
    1. Zenz T, Gribben JG, Hallek M, Dohner H, Keating MJ, Stilgenbauer S. Risk categories and refractory CLL in the era of chemoimmunotherapy. Blood. 2012;119:4101–4107. - PMC - PubMed
    1. Hallek M, Cheson BD, Catovsky D, Caligaris-Cappio F, Dighiero G, Dohner H, et al. Guidelines for the diagnosis and treatment of chronic lymphocytic leukemia: a report from the International Workshop on Chronic Lymphocytic Leukemia updating the National Cancer Institute-Working Group 1996 guidelines. Blood. 2008;111:5446–5456. - PMC - PubMed
    1. Rawstron AC, Villamor N, Ritgen M, Bottcher S, Ghia P, Zehnder JL, et al. International standardized approach for flow cytometric residual disease monitoring in chronic lymphocytic leukaemia. Leukemia. 2007;21:956–964. - PubMed
    1. Rawstron AC, Bottcher S, Letestu R, Villamor N, Fazi C, Kartsios H, et al. Improving efficiency and sensitivity: European Research Initiative in CLL (ERIC) update on the international harmonised approach for flow cytometric residual disease monitoring in CLL. Leukemia. 2013;27:142–149. - PubMed

Publication types

Substances