

APOE and BCHE as modulators of cerebral amyloid deposition: a florbetapir PET genome-wide association study
- PMID: 23419831
- PMCID: PMC3661739
- DOI: 10.1038/mp.2013.19
APOE and BCHE as modulators of cerebral amyloid deposition: a florbetapir PET genome-wide association study
Abstract
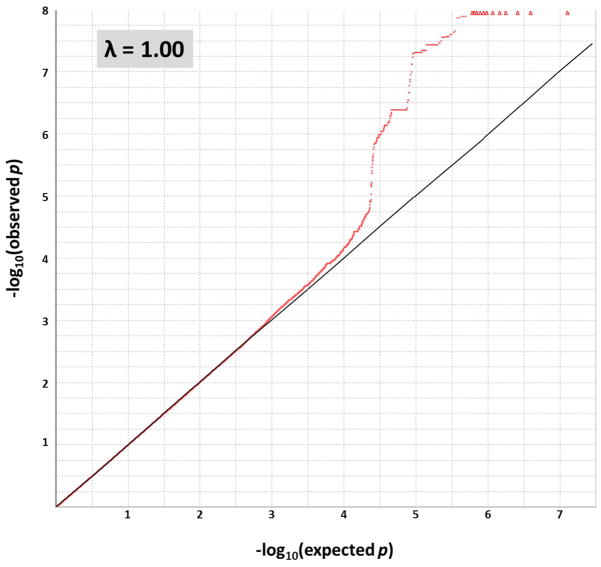
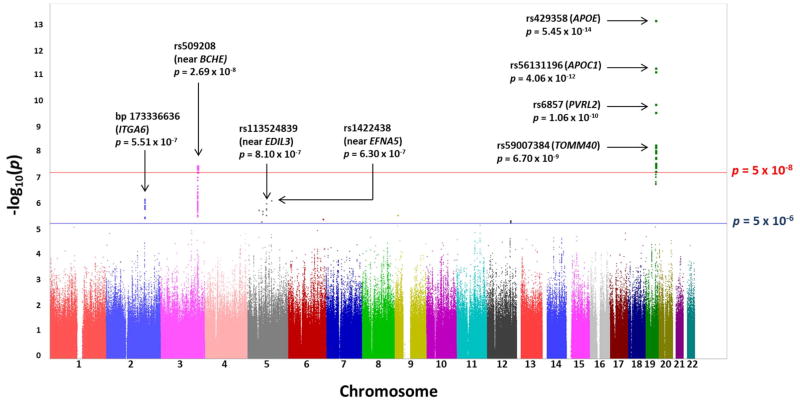
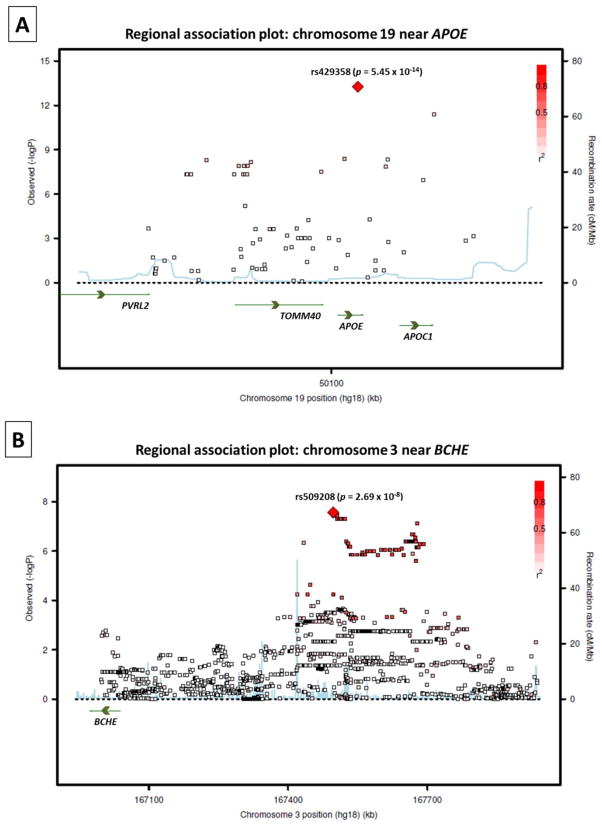
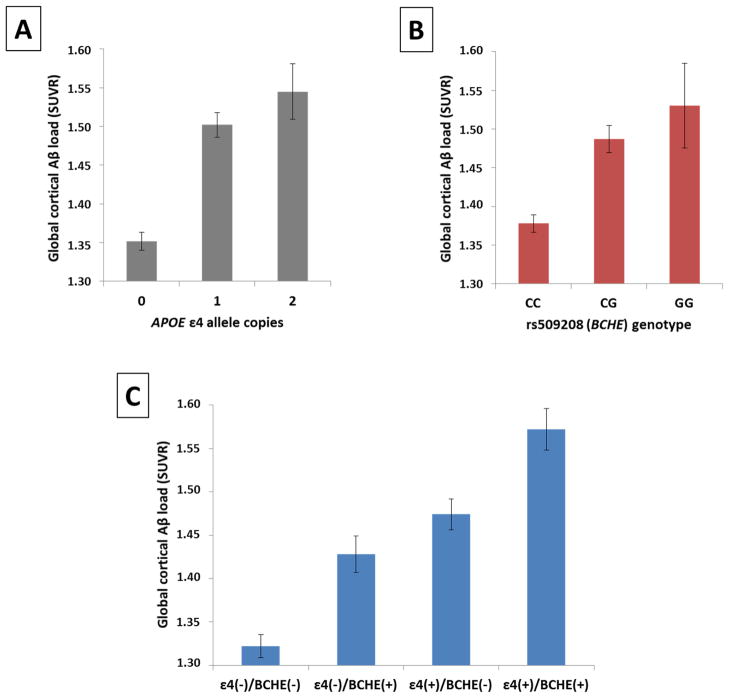
Deposition of amyloid-β (Aβ) in the cerebral cortex is thought to be a pivotal event in Alzheimer's disease (AD) pathogenesis with a significant genetic contribution. Molecular imaging can provide an early noninvasive phenotype, but small samples have prohibited genome-wide association studies (GWAS) of cortical Aβ load until now. We employed florbetapir ((18)F) positron emission tomography (PET) imaging to assess brain Aβ levels in vivo for 555 participants from the Alzheimer's Disease Neuroimaging Initiative (ADNI). More than six million common genetic variants were tested for association to quantitative global cortical Aβ load controlling for age, gender and diagnosis. Independent genome-wide significant associations were identified on chromosome 19 within APOE (apolipoprotein E) (rs429358, P=5.5 × 10(-14)) and on chromosome 3 upstream of BCHE (butyrylcholinesterase) (rs509208, P=2.7 × 10(-8)) in a region previously associated with serum BCHE activity. Together, these loci explained 15% of the variance in cortical Aβ levels in this sample (APOE 10.7%, BCHE 4.3%). Suggestive associations were identified within ITGA6, near EFNA5, EDIL3, ITGA1, PIK3R1, NFIB and ARID1B, and between NUAK1 and C12orf75. These results confirm the association of APOE with Aβ deposition and represent the largest known effect of BCHE on an AD-related phenotype. BCHE has been found in senile plaques and this new association of genetic variation at the BCHE locus with Aβ burden in humans may have implications for potential disease-modifying effects of BCHE-modulating agents in the AD spectrum.
Conflict of interest statement
Dr. Jagust has served as a consultant to TauRx Therapeutics LTD, GE Healthcare, Siemens, Synarc, and Janssen Alzheimer Immunotherapy. Dr. Weiner has served on scientific advisory boards for Eli Lilly, Araclon, Institut Catala de Neurociencies Aplicades, the Gulf War Veterans Illnesses Advisory Committee, Biogen Idec, and Pfizer; has served as a consultant to Astra Zeneca, Araclon, Medivation/Pfizer, Ipsen, TauRx Therapeutics LDT, Bayer Healthcare, Biogen Idec, Exonhit Therapeutics, Servier, Synarc, Janssen, Harvard University, and KLJ Associates; has received funding for travel from NeuroVigil, Inc., CHRU Hôpital Roger Salengro, Siemens, AstraZeneca, Geneva University Hospitals, Eli Lilly, Paris University, Institut Catala de Neurociencies Aplicades, University of New Mexico School of Medicine, Ipsen, Clinical Trials on Alzheimer’s Disease, the AD/PD Meeting, Paul Sabatier University, Novartis, Tohoku University, Fundacio ACE, and Travel eDreams, Inc.; has received honoraria from NeuroVigil, Inc., Institut Catala de Neurociencies Aplicades, PMDA/Japanese Ministry of Health, Labour, and Welfare, Tohoku University, and the Alzheimer’s Drug Discovery Foundation; has received research support from Merck and Avid; and has stock options for Synarc and Elan. Dr. Saykin has received investigator-initiated research funding from Welch Allyn and Siemens Healthcare and has served as a consultant or advisory board member for Siemens Healthcare and Eli Lilly. The other authors declare no conflict of interest.
Figures
References
-
- Karran E, Mercken M, De Strooper B. The amyloid cascade hypothesis for Alzheimer’s disease: an appraisal for the development of therapeutics. Nat Rev Drug Discov. 2011;10(9):698–712. - PubMed
-
- Petersen RC, Parisi JE, Dickson DW, Johnson KA, Knopman DS, Boeve BF, et al. Neuropathologic features of amnestic mild cognitive impairment. Arch Neurol. 2006;63(5):665–672. - PubMed
-
- Bennett DA, Schneider JA, Arvanitakis Z, Kelly JF, Aggarwal NT, Shah RC, et al. Neuropathology of older persons without cognitive impairment from two community-based studies. Neurology. 2006;66(12):1837–1844. - PubMed
-
- Sleegers K, Lambert JC, Bertram L, Cruts M, Amouyel P, Van Broeckhoven C. The pursuit of susceptibility genes for Alzheimer’s disease: progress and prospects. Trends in genetics: TIG. 2010;26(2):84–93. - PubMed
Publication types
MeSH terms
Substances
Grants and funding
- K01 AG030514/AG/NIA NIH HHS/United States
- R01 AG019771/AG/NIA NIH HHS/United States
- K99 LM011384/LM/NLM NIH HHS/United States
- R01 LM011360/LM/NLM NIH HHS/United States
- K24 AG027841/AG/NIA NIH HHS/United States
- R01 AG19771/AG/NIA NIH HHS/United States
- P30 AG010129/AG/NIA NIH HHS/United States
- U24 AG21886/AG/NIA NIH HHS/United States
- R00 LM011384/LM/NLM NIH HHS/United States
- P30 AG10133/AG/NIA NIH HHS/United States
- P30 AG010133/AG/NIA NIH HHS/United States
- U24 AG021886/AG/NIA NIH HHS/United States
- U01 AG024904/AG/NIA NIH HHS/United States
- U19 AG010483/AG/NIA NIH HHS/United States
- RC2 AG036535/AG/NIA NIH HHS/United States
- UL1 TR001108/TR/NCATS NIH HHS/United States
LinkOut - more resources
Full Text Sources
Other Literature Sources
Medical
Miscellaneous
