. 2013 Jul 1:74:318-25.
doi: 10.1016/j.neuroimage.2013.02.010. Epub 2013 Feb 16.

Functional brain imaging of multi-sensory vestibular processing during computerized dynamic posturography using near-infrared spectroscopy

Affiliations

Functional brain imaging of multi-sensory vestibular processing during computerized dynamic posturography using near-infrared spectroscopy

Helmet Karim et al. Neuroimage. .

Abstract

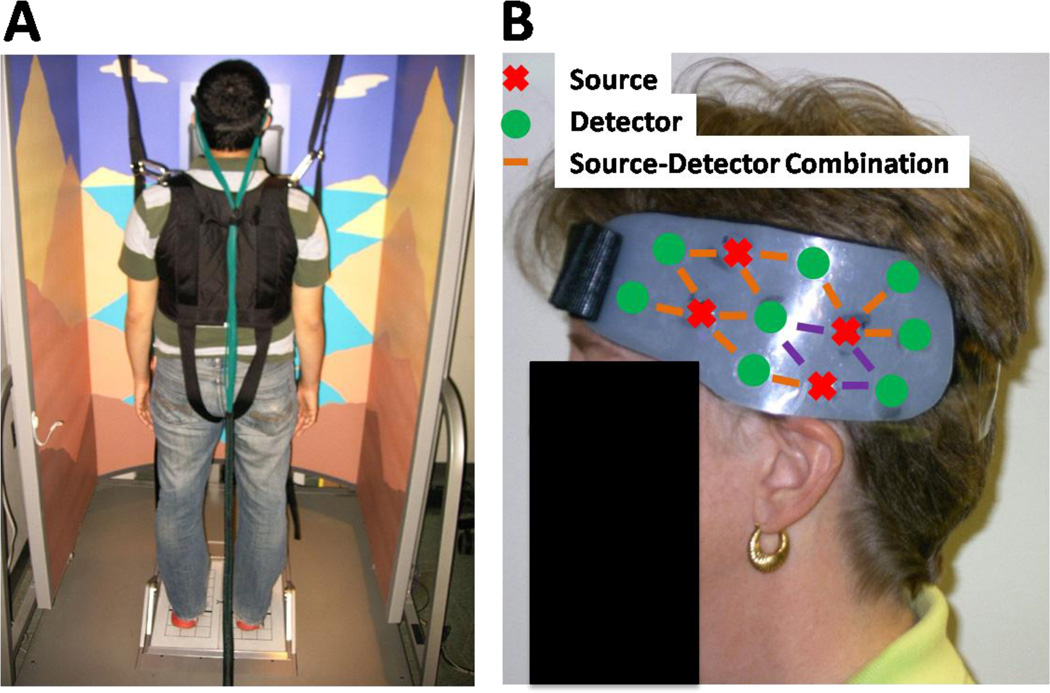
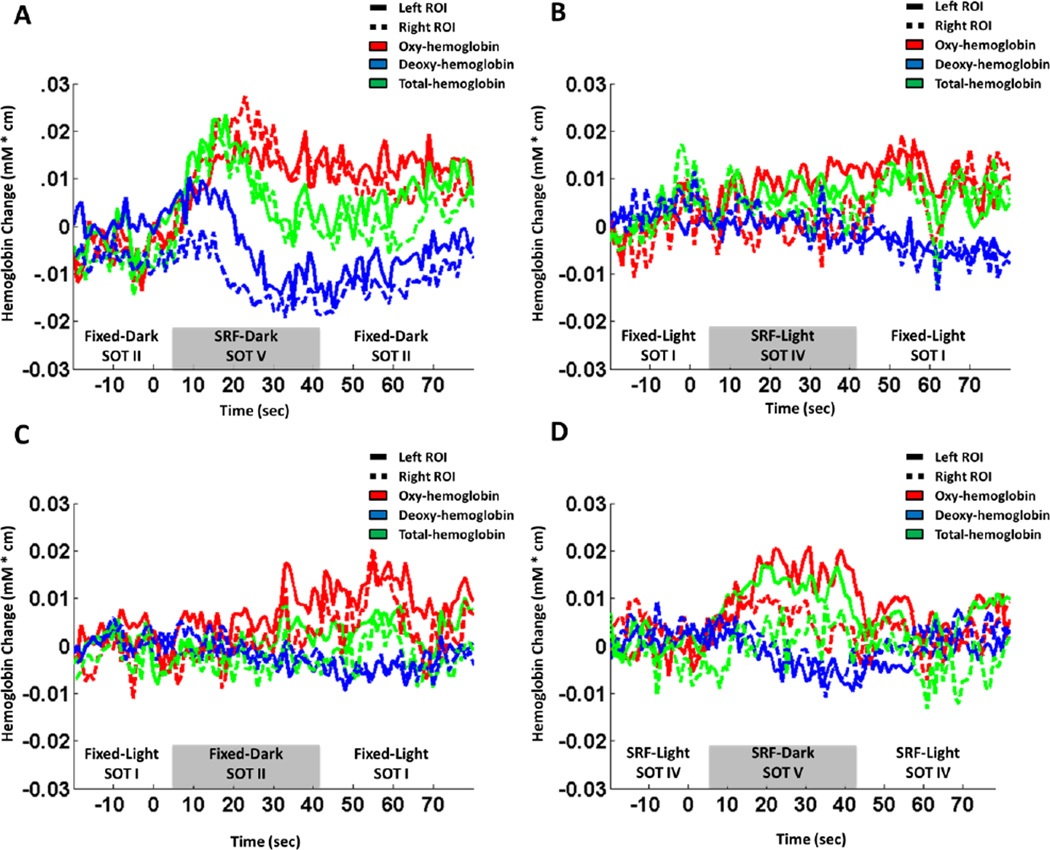
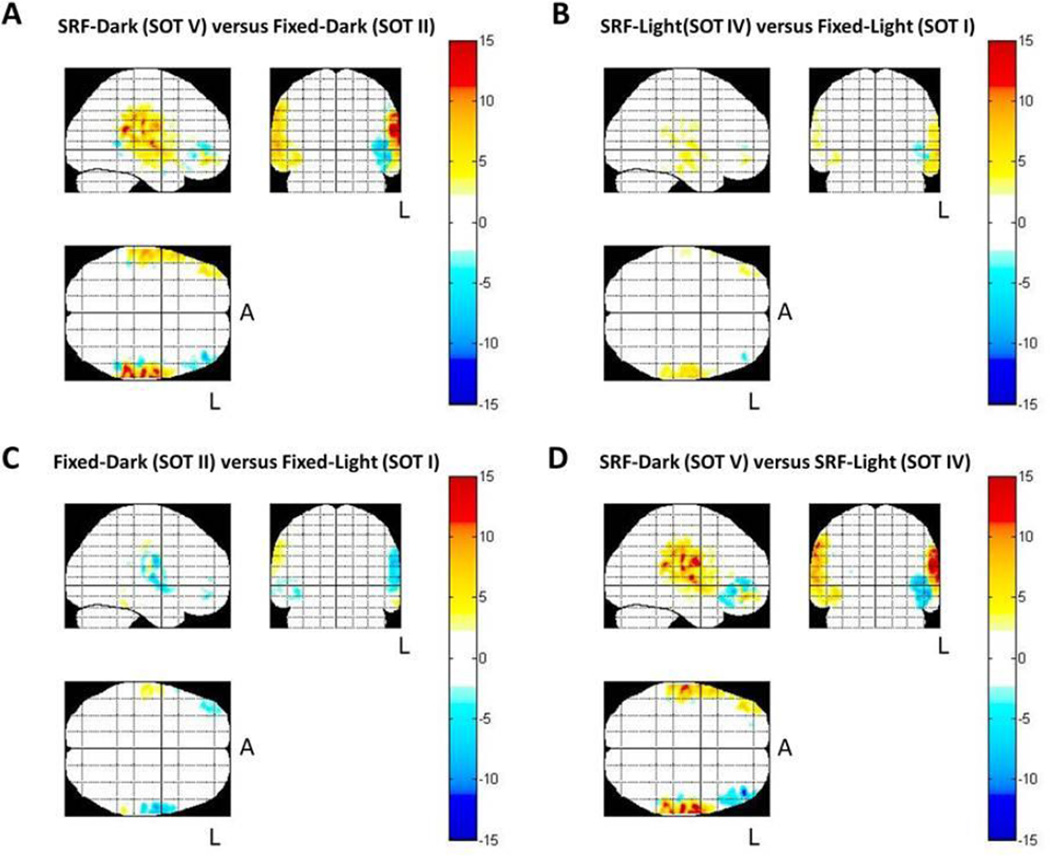
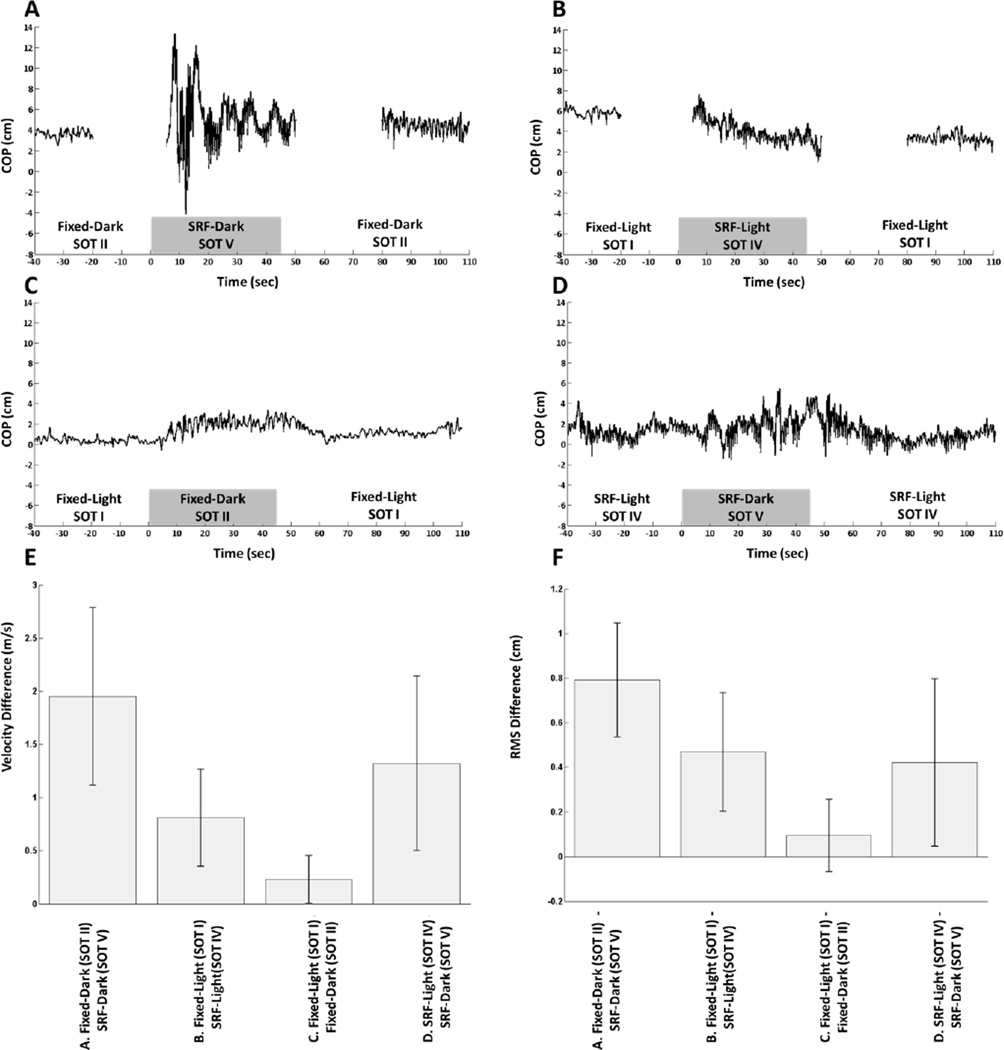
Functional near-infrared spectroscopy (fNIRS) is a non-invasive brain imaging method that uses light to record regional changes in cerebral blood flow in the cortex during activation. fNIRS uses portable wearable sensors to allow measurements of brain activation during tasking. In this study, fNIRS was used to investigate how the brain processes information from multiple sensory modalities during dynamic posturography. Fifteen healthy volunteers (9M/6F; ages 28+/-9 yrs) participated in the posturography study while undergoing fNIRS brain imaging. Four standard conditions from the sensory organization test (SOT) were performed and a bilateral fNIRS probe was used to examine the cortical brain responses from the frontal, temporal, and parietal brain regions. We found that there was bilateral activation in the temporal-parietal areas (superior temporal gyrus, STG, and supramarginal gyrus, SMG) when both vision and proprioceptive information were degraded; forcing reliance on primarily vestibular information in the control of balance. This is consistent with previous reports of the role of these regions in vestibular control and demonstrates the potential utility of fNIRS in the study of cortical control of vestibular function during standing balance tasks.


Conflict of interest statement

The authors declare no conflicts of interest.

Figures

Figure 1
Figure 1
Setup of fNIRS and dynamic posturography. (panel A) Subjects were harnessed into the Equitest™ system with fNIRS head cap attached. The fiber optic cables (green fibers) deliver light to and from the head cap and CW6 system. (panel B) View of the left side of the bilateral probe. Source-detector combinations in purple are a region of interest (ROI) used in figure 2.
Figure 2
Figure 2
The ensemble-averaged fNIRS time course for all four SOT combinations in this study in two (right and left, see figure 1) temporal-parietal source-detector combinations. These source detector combinations sample a region over the superior temporal gyrus (STG).
Figure 3
Figure 3
Estimated spatial maps (T-test) of the oxy-hemoglobin data collected using fNIRS for the change in brain activity between the test and baseline conditions using all source-detector combinations. The color bar represents the results of the t-statistic (T-score). Areas in red indicate regions more activated (increased oxy-hemoglobin) during the comparison. Areas in blue indicate decreased oxyhemoglobin during the test condition in comparison to the baseline condition. Data are displayed as a maximum intensity projection along the sagittal, coronal, and axial directions. The L indicates the left side of the brain and the A represents anterior. Only areas with significant activation (p<0.05; corrected) are shown.
Figure 4
Figure 4
Representative anterior-posterior center of pressure (COP) data from a single subject collected from the Equitest™ system (A-D). When subjects went from SOT II to SOT V and from SOT I and SOT IV, the COP data were collected in three separate files (indicated by a gap in the data) since the clinical Equitest™ system does not support a smooth transition between fixed to sway-referenced floor (SRF). FNIRS data were recorded continuously. Velocity difference (E) and RMS difference (F) were calculated across all subjects. Error bars represent one standard deviation.

References

    1. Abdelnour AF, Huppert T. Real-time imaging of human brain function by near-infrared spectroscopy using an adaptive general linear model. Neuroimage. 2009;46:133–143. - PMC - PubMed
    1. Abdelnour AF, Huppert TJ. A random-effects model for group-level analysis of diffuse optical brain imaging. Biomedical Optics Expres. 2011;2:1–25. - PMC - PubMed
    1. Abdelnour F, Genovese C, Huppert T. Hierarchical Bayesian regularization of reconstructions for diffuse optical tomography using multiple priors. Biomedical optics express. 2010;1:1084–1103. - PMC - PubMed
    1. Abdelnour F, Schmidt B, Huppert TJ. Topographic localization of brain activation in diffuse optical imaging using spherical wavelets. Phys Med Biol. 2009;54:6383–6413. - PMC - PubMed
    1. Barin K. Dynamic Posturography: Analysis of Error in Force Plate Measurement of Postural Sway. IEEE Engineering in Medicine and Biology Magazine. 1992;11:52–56.

Publication types