. 2013 Apr 18;121(16):3246-53.
doi: 10.1182/blood-2013-01-476390. Epub 2013 Feb 19.

Isolation and functional characterization of human erythroblasts at distinct stages: implications for understanding of normal and disordered erythropoiesis in vivo

Affiliations

Isolation and functional characterization of human erythroblasts at distinct stages: implications for understanding of normal and disordered erythropoiesis in vivo

Jingping Hu et al. Blood. .

Abstract

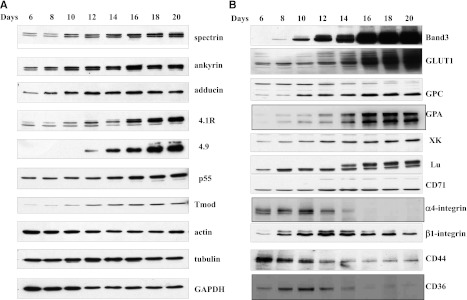
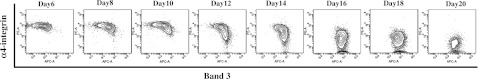
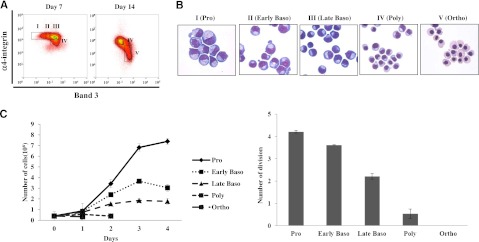
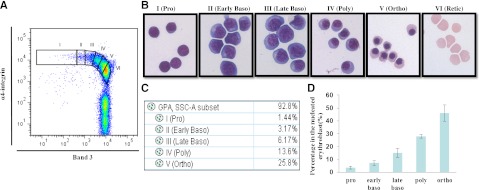
Terminal erythroid differentiation starts from morphologically recognizable proerythroblasts that proliferate and differentiate to generate red cells. Although this process has been extensively studied in mice, its characterization in humans is limited. By examining the dynamic changes of expression of membrane proteins during in vitro human terminal erythroid differentiation, we identified band 3 and α4 integrin as optimal surface markers for isolating 5 morphologically distinct populations at successive developmental stages. Functional analysis revealed that these purified cell populations have distinct mitotic capacity. Use of band 3 and α4 integrin enabled us to isolate erythroblasts at specific developmental stages from primary human bone marrow. The ratio of erythroblasts at successive stages followed the predicted 1:2:4:8:16 pattern. In contrast, bone marrows from myelodysplastic syndrome patients exhibited altered terminal erythroid differentiation profiles. Thus, our findings not only provide new insights into the genesis of the red cell membrane during human terminal erythroid differentiation but also offer a means of isolating and quantifying each developmental stage during terminal erythropoiesis in vivo. Our findings should facilitate a comprehensive cellular and molecular characterization of each specific developmental stage of human erythroblasts and should provide a powerful means of identifying stage-specific defects in diseases associated with pathological erythropoiesis.


Figures

Figure 1
Figure 1
Immunoblots of membrane proteins of erythroblasts at different stages of human terminal erythroid differentiation. Blots of SDS-PAGE of total cellular protein prepared from erythroblasts cultured for different days were probed with antibodies against the indicated proteins. (A) Skeletal proteins and (B) transmembrane proteins. GADPH, glyceraldehyde-3-phosphate dehydrogenase.
Figure 2
Figure 2
Flow cytometric analysis of expression of membrane proteins at cell surface at different stages of human terminal erythroid differentiation. The erythroblasts cultured for different days were stained with antibodies against the indicated proteins. The ordinate measures the number of cells displaying the fluorescent intensity given by the abscissa. Note progressive and dramatically increased expression of band 3 throughout terminal erythroid differentiation and decreased expression of α4 integrin during the late stage of terminal erythroid differentiation.
Figure 3
Figure 3
Flow cytometric analysis of in vitro differentiated human erythroid cells. The in vitro cultured erythroblasts at different days were stained with GPA, α4 integrin, and band 3. The plots of α4 integrin vs band 3 of all TER-positive cells are shown. Note the progressive change of α4 integrinhiband3neg population to α4 integrinnegband3hi population during terminal erythroid differentiation.
Figure 4
Figure 4
Isolation and characterization of human erythroblasts at distinct stages of development by cell sorting using GPA, band 3, and α4 integrin as surface markers. (A) The in vitro cultured day 7 or day 14 erythroblasts were stained with GPA, α4 integrin, and band 3. The expression levels of α4 integrin of all GPA+ cells were plotted again the expression levels of band 3. The data are displayed using both contour and density plots. Band 3 negative cells are gated as population I. Population III is represented by the cluster expressing medium level of band 3 and high level of α4 integrin. The region between I and III is gated as population II. Two distinct populations (IV and V) are clearly separated on cells cultured for 14 days. (B) Representative images of erythroblast morphology on stained cytospins from the 6 distinct regions shown in Figure 4A. Pro, proerythroblast; early baso, early basophilic erythroblast; late baso, late basophilic erythroblast; poly, polychromatic erythroblast; ortho, orthochromatic erythroblast. (C) Mitotic ability of purified staged human erythroblasts. Left panel: representative growth curves of staged human erythroblasts. Right panel: number of cell divisions of staged human erythroblasts. Data shown are from 4 independent experiments.
Figure 5
Figure 5
Flow cytometry analysis and isolation of primary human bone marrow erythroblasts. CD45- cells isolated from primary human bone marrow were stained with GPA, α4 integrin, and band 3. (A) Plot of band 3 vs α4 integrin of GPA+ cells. (B) Representative images of the sorted cells gated in A. (C) Proportions of distinct stages of erythroblasts in bone marrow shown in A. (D) Quantitation of the proportion of cells at each distinct stage of maturation after normalization based on total nucleated erythroid cells as 100% (N = 7).
Figure 6
Figure 6
Terminal erythropoiesis profiles of primary human bone marrow cells from MDS patients. CD45- cells isolated from primary human bone marrow of 6 MDS patients, each with a different MDS subtype, were stained and analyzed, as described in Figure 5. Proportions of distinct stages of erythroblasts, after normalization based on total nucleated erythroid cells as 100%, are indicated. Panels A, B, C, D, E, and F show the terminal erythropoiesis profile of the MDS subtype refractory anemia, refractory anemia with ringed sideroblasts, refractory cytopenia with multilineage dysplasia, refractory cytopenia with multilineage dysplasia and ringed sideroblasts, refractory anemia with excess blasts-1, and refractory anemia with excess blasts-2, respectively. (I) proerythroblasts; (II) early basophilic erythroblasts; (III) late basophilic erythroblasts; (IV) polychromatic erythroblasts; and (V) orthchromatic erythroblasts.

References

    1. Stephenson JR, Axelrad AA, McLeod DL, Shreeve MM. Induction of colonies of hemoglobin-synthesizing cells by erythropoietin in vitro. Proc Natl Acad Sci USA. 1971;68(7):1542–1546. - PMC - PubMed
    1. Chang H, Langer PJ, Lodish HF. Asynchronous synthesis of erythrocyte membrane proteins. Proc Natl Acad Sci USA. 1976;73(9):3206–3210. - PMC - PubMed
    1. Blikstad I, Nelson WJ, Moon RT, Lazarides E. Synthesis and assembly of spectrin during avian erythropoiesis: stoichiometric assembly but unequal synthesis of alpha and beta spectrin. Cell. 1983;32(4):1081–1091. - PubMed
    1. Hanspal M, Hanspal JS, Kalraiya R, Liu SC, Sahr KE, Howard D, Palek J. Asynchronous synthesis of membrane skeletal proteins during terminal maturation of murine erythroblasts. Blood. 1992;80(2):530–539. - PubMed
    1. Peters LL, White RA, Birkenmeier CS, Bloom ML, Lux SE, Barker JE. Changing patterns in cytoskeletal mRNA expression and protein synthesis during murine erythropoiesis in vivo. Proc Natl Acad Sci USA. 1992;89(13):5749–5753. - PMC - PubMed

Publication types