. 2013 Mar 11;54(3):1805-15.
doi: 10.1167/iovs.11-9310.

Nuclear atrophy of retinal ganglion cells precedes the bax-dependent stage of apoptosis

Affiliations

Nuclear atrophy of retinal ganglion cells precedes the bax-dependent stage of apoptosis

Katherine T Janssen et al. Invest Ophthalmol Vis Sci. .

Abstract

Purpose: Retinal ganglion cells atrophy during the execution of the intrinsic apoptotic program. This process, which has been termed the apoptotic volume decrease (AVD) in other cell types, has not been well-characterized in ganglion cells.

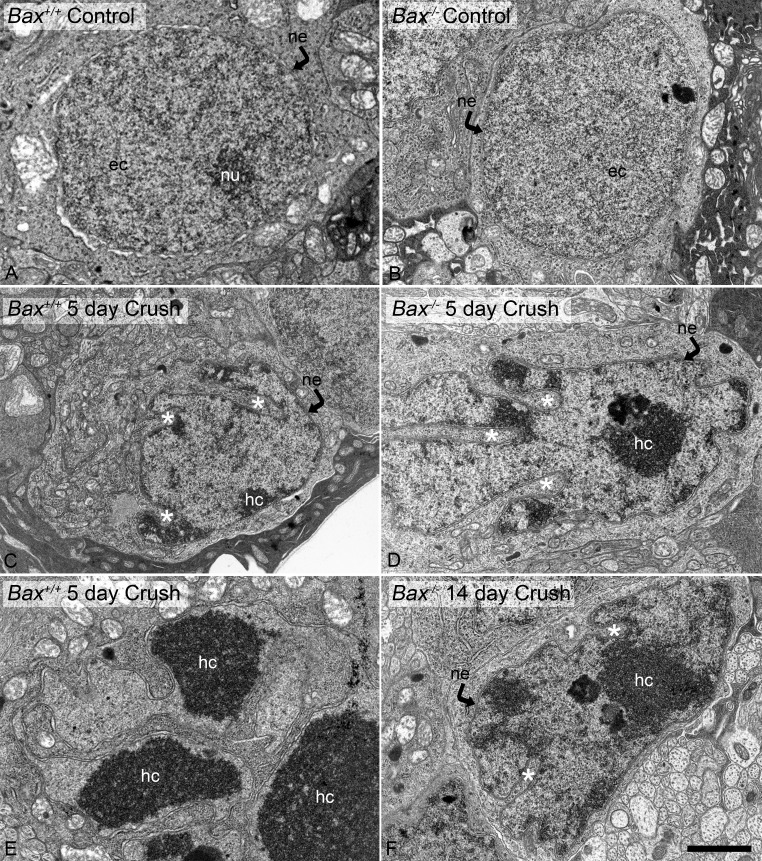
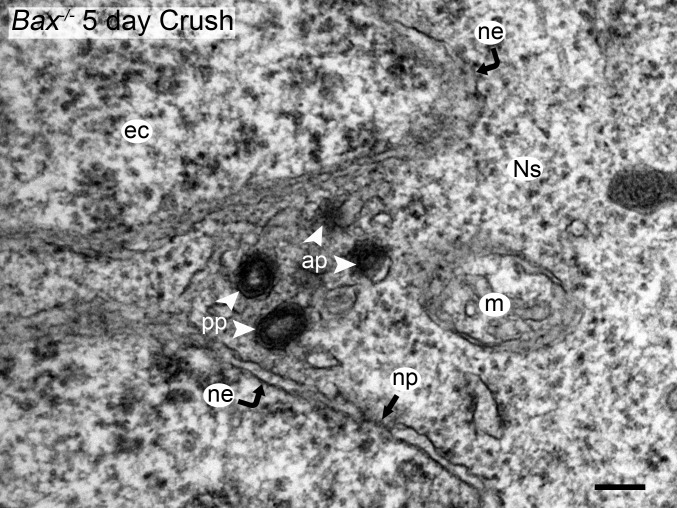
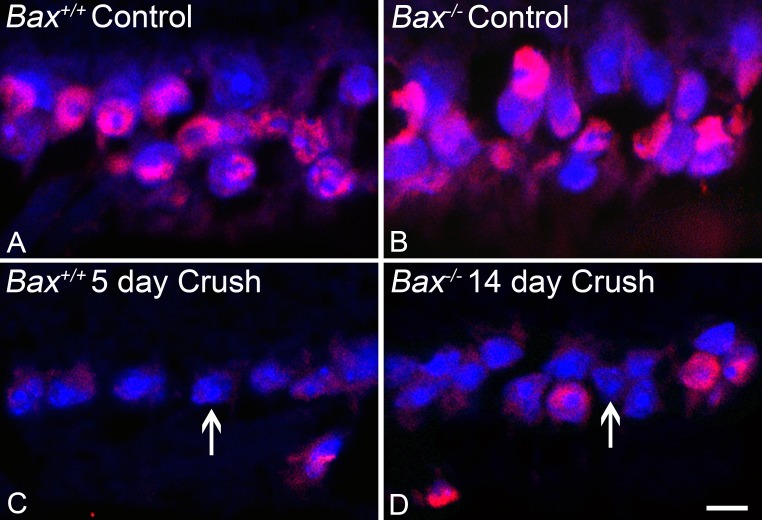
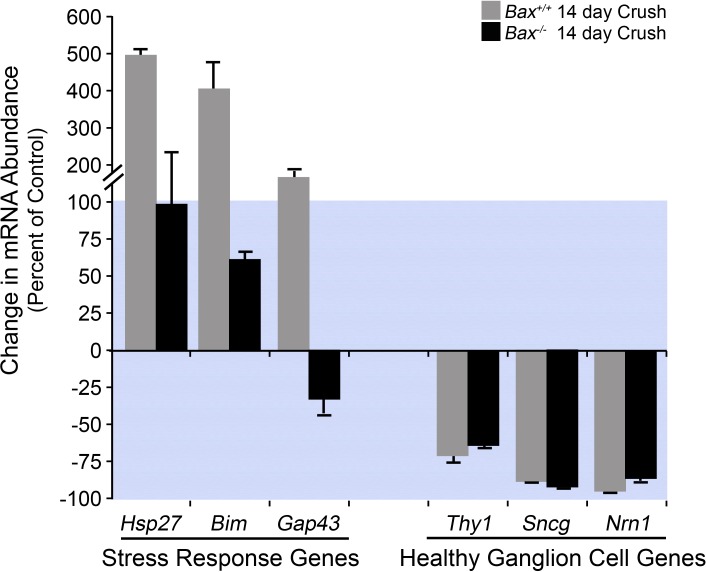
Methods: Acute optic nerve crush was used to examine neuronal atrophy in the ganglion cell layer in wild-type and Bax-deficient mice. Nuclear size was measured from retinal wholemounts. Heterochromatin formation was assessed using transmission electron microscopy, whereas histone H4 acetylation was monitored using immunofluoresence. Ganglion cell and retinal transcript abundance was measured using quantitative PCR.

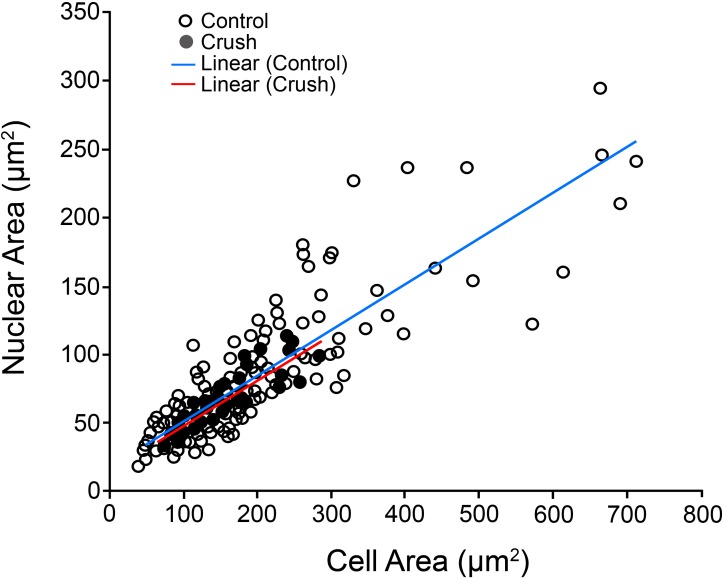
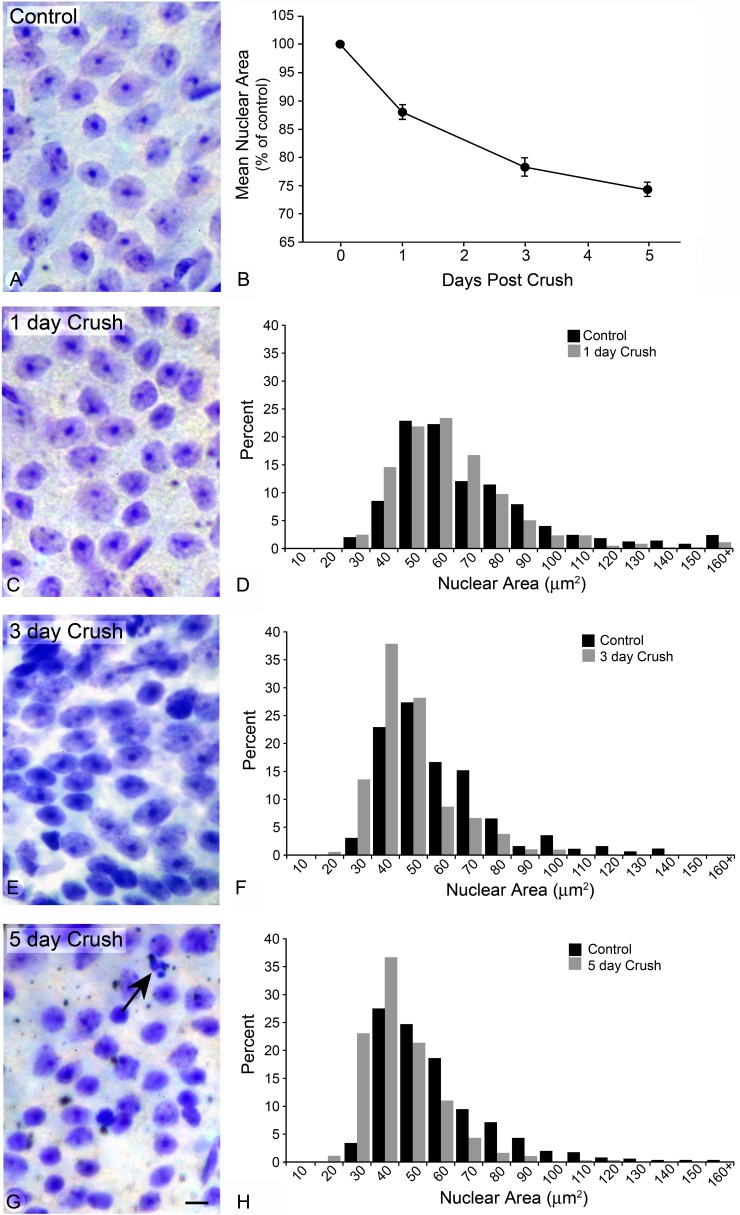
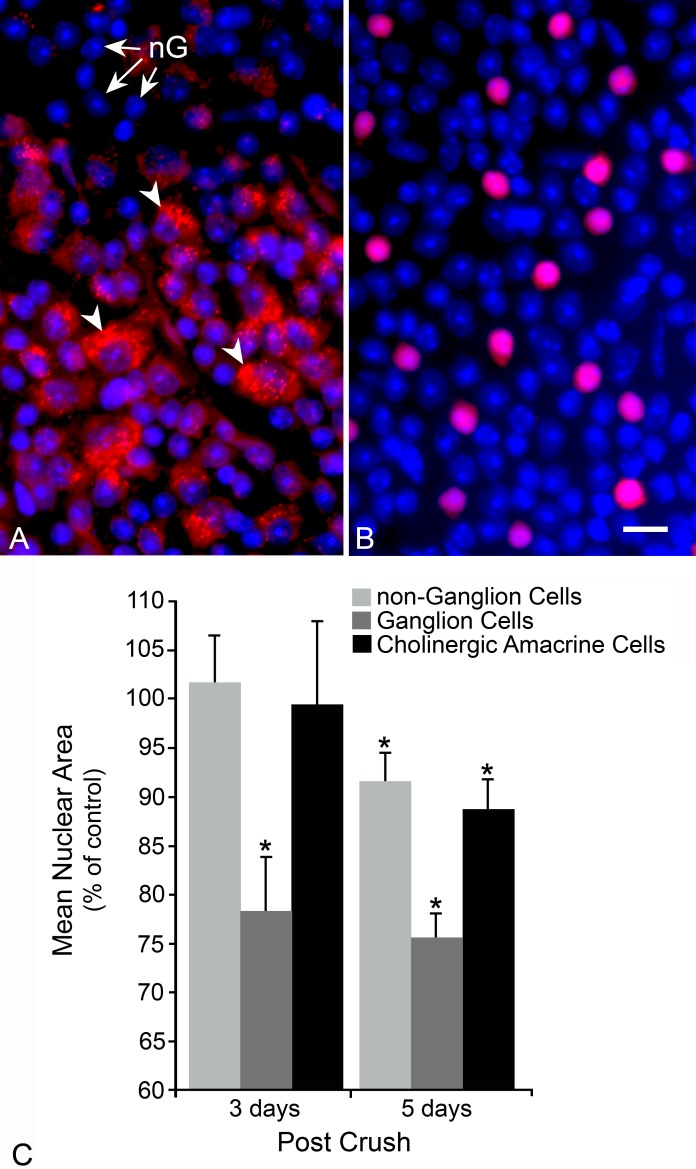
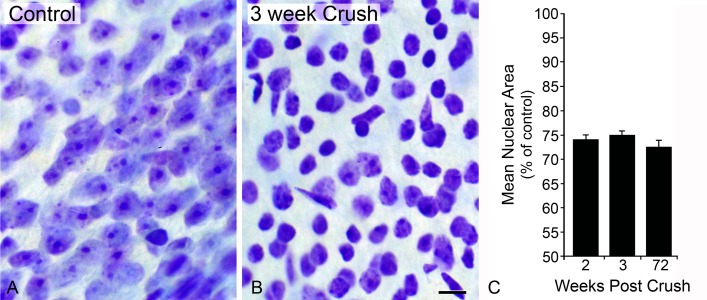
Results: Nuclear and soma sizes linearly correlated in both control and damaged retinas. Cells in wild-type mice exhibited nuclear atrophy within 1 day after optic nerve damage. Three days after crush, nuclear atrophy was restricted to ganglion cells identified by retrograde labeling, while amacrine cells also exhibited some atrophy by 5 days. Similar kinetics of nuclear atrophy were observed in cells deficient for the essential proapoptotic gene Bax. Bax-deficient cells also exhibited other nuclear changes common in wild-type cells, including the deacetylation of histones, formation of heterochromatin, and the silencing of ganglion cell-specific gene expression.

Conclusions: Retinal ganglion cell somas and nuclei undergo the AVD in response to optic nerve damage. Atrophy is rapid and precedes the Bax-dependent committed step of the intrinsic apoptotic pathway.


Conflict of interest statement

Disclosure: K.T. Janssen, None; C.E. Mac Nair, None; J.A. Dietz, None; C.L. Schlamp, None; R.W. Nickells, None

Figures

Figure 1
Figure 1
Scatter plot of cell soma area versus nuclear area. Cell soma areas and their corresponding nuclear areas were measured from Nissl-stained retinal wholemounts for cells that had clearly defined edges. Cell sizes were obtained from crush retinas at either 3 or 5 days after surgery to ensure that changes in cell size had ample time to occur after damage to the optic nerve. The best fit straight line for each data set is shown (blue for control and red for crush). Overall, control retinas contain more larger-sized cells than crush retinas (ANOVA, P = 0.008), but the linear relationships between the two variables are nearly identical for each data set (y = 0.334x + 17.4 and y = 0.332x + 14.0 for control and crush retinas, respectively, P = 0.36).
Figure 2
Figure 2
Time course of Nissl-stained retina wholemounts from wild-type mice after optic nerve crush. Representative images of Nissl-stained retinal wholemounts of mouse retinas before (A) and after optic nerve crush (C, E, G). All images were taken from the superior quadrants of each retina, approximately 1 mm from the optic nerve head and represent an area that has the same approximate density of cells. (A) Neuronal nuclei in control retinas appear plump and lightly stained with the exception of 1 or 2 prominent nucleoli. In preparations like these, vascular endothelial cells appear elongated, whereas astrocytes are often small and round. In both cases, the nuclei of these cells are densely stained. Shortly after crush, the mean nuclear area of cells in the ganglion cell layer decreases relative to fellow control eyes (B). The decrease in size progresses to a maximum by 5 days after the surgery. At 1 day after crush (C), the nuclei are still relatively normal in appearance. A histograph of different cell sizes (D) shows a subtle loss of the largest cells and an increase in the proportion of small cells (control population, black bars; crush population, grey bars). (E) At 3 days after crush, nuclei are noticeably smaller and exhibit a greater proportion of darker staining, while histograph analysis shows a prominent increase in the proportion of smaller cells (F). (G) By 5 days after crush, the nuclei are noticeably smaller, and in wild-type mice, there are clearly signs of nuclear fragmentation (arrow). A histograph analysis (H) shows nearly complete loss of larger cells and a dramatic increase in the proportion of small cells. Scale bar: 10 μm. The decrease in nuclear area is significant at all 3 time points (ANOVA, P < 0.0001).
Figure 3
Figure 3
Atrophy of different neuronal populations in the ganglion cell layer. The nuclear sizes of distinct nonganglion and ganglion cell populations were measured in mouse retinas at 3 and 5 days after optic nerve crush. (A) Image of a section of a wholemount of the ganglion cell layer of a mouse retina, 5 days after crush. Ganglion cells were identified by retrograde labeling with DiI, while nuclei were identified by DAPI staining. DiI-negative cells with round nuclei and prominent nucleoli were selected as nonganglion cell neurons for analysis (nG, arrows). Cells that were unambiguously positive for retrograde DiI label (red) were selected for ganglion cells. Some ganglion cells also exhibited condensed DAPI staining (select examples highlighted with arrowheads). (B) Image of a section of a wholemounted retina of the ganglion cell layer of a Rosa26R-LoxP-tdTomato reporter mouse also transgenic for Cre recombinase under control of the choline acetyltransferase (Tg(Chat-cre)GM24Gsat). Cholinergic amacrine cells appear red. DAPI counterstain. Scale bar for (A, B): 10 μm. (C) Graph showing the mean change in nuclear area (±SEM, percentage of area of fellow control retinas) of nonganglion and ganglion cell subsets, and cholinergic amacrine cells, at 3 and 5 days after crush. At 3 days, only ganglion cells appear atrophied, while both nonganglion and ganglion cell populations are atrophied by 5 days. Populations of cells showing a significant change relative to control retina cell populations are indicated (*P < 0.05).
Figure 4
Figure 4
Nuclear area measurements in Bax−/− mice after optic nerve crush. To determine if nuclear shrinkage occurred before the committed step of the intrinsic apoptotic program, and before the activation of caspases, we examined nuclear area in Bax−/− mice after optic nerve crush. Retinal ganglion cells are absolutely dependent on BAX protein function to execute cell death after optic nerve crush. Nissl-stained retinal wholemounts of control (A) and crush (B) retinas, 3 weeks after optic nerve damage. Neurons in the Bax−/− control retinas have a similar appearance to these cells in wild-type mice, including a plump appearance, lightly staining nucleoplasm, and densely staining nucleoli. After optic nerve crush, however, the nuclei are noticeably smaller and stain more intensely. Cell density between these images, however, remains similar because ganglion cells are arrested in the apoptotic program and have not been cleared. Scale bar: 10 μm. (C) Histographs of the mean change in nuclear area (±SEM relative to fellow control retinas) for Bax−/− mice at 2, 3, and 72 weeks after optic nerve crush. Each population is significantly smaller than control fellow eyes (P < 0.001 for each bar). Bax-deficient nuclei atrophy to a similar extent as nuclei in wild-type mice (approximately 25% atrophy, compare to Fig. 2B), and appear to remain atrophied indefinitely.
Figure 5
Figure 5
Ultrastructure of ganglion cell layer nuclei in wild-type and Bax−/− mice after optic nerve crush. Transmission electron micrographs of cells in the ganglion cell layer of wild-type (A, C, E) and Bax−/− (B, D, F) mice. The most prominent nuclear appearance in the ganglion cell layer of control retinas (A, B) was of round or slightly oval nuclei with a small electron-dense nucleolus (nu) and uniformly staining nucleoplasm, typical of euchromatin (ec). After optic nerve crush, these nuclei became less obvious and were replaced by nuclei exhibiting highly convoluted sinuses (asterisks in [C, D, F]). Although these nuclei still contained an intact nuclear envelope (ne), they also exhibited increased deposition of electron-dense heterochromatin (hc). Some nuclei in wild-type mice also appeared completely electron dense and fragmented (E), with no evidence of an intact nuclear envelope. Nuclei in Bax−/− mice never reached this stage of nuclear condensation, and appeared similar at 5 and 14 days after crush. Scale bar: 1.5 μm.
Figure 6
Figure 6
High magnification of a Bax−/− cell after optic nerve crush. Detail of the nuclear envelope and cytoplasm of a Bax−/− cell 5 days after optic nerve crush. In both wild-type and Bax−/− retinas, cells affected by optic nerve crush accumulated electron-dense vesicles, which appeared to be autophagosomes (ap) or their precursors, phagophores (pp). Otherwise, the cytoplasm appeared normal with granular-appearing polyribosomes (Nissl-substance, Ns) and mitochondria (m). These cells also exhibited relatively normal-appearing rough endoplasmic reticulum and Golgi (not shown). Convoluted nuclei contained both light-staining euchromatin (ec) and electron-dense heterochromatin. These nuclei had intact nuclear envelopes (ne), with normal-appearing nuclear pore structures (np). Affected Bax−/− cells appeared similar in retinas both 5 and 14 days after optic nerve crush. Scale bar: 130 nm.
Figure 7
Figure 7
Immunofluorescent staining for acetyl histone H4 in nuclei of wild-type and Bax−/− mice after optic nerve crush. Confocal optical sections through the ganglion cell layer of control and experimental mouse retinas after optic nerve crush. Sections were immunostained for acetylated histone H4 (red) and counterstained with DAPI (blue). Only merged images are shown. (A, C) Sections from wild-type mice 5 days after crush. (B, D) Sections from Bax−/− mice 14 days after crush. In control retinas, most nuclei stain strongly for acetylated H4 and have normal-appearing nuclei by DAPI staining. After crush, however, nuclei exhibiting increases in DNA condensation (more intense and mottled DAPI staining; representative nuclei highlighted by arrows in [C, D]) are weakly positive for acetylated H4. This pattern of histone deacetylation was also evident in Bax−/− samples collected 5 days after crush (data not shown). Scale bar: 10 μm.
Figure 8
Figure 8
Histographs of retinal ganglion cell transcript abundance after optic nerve crush. The levels of six different mRNAs were analyzed in the retinas of wild-type and Bax−/− mice, 2 weeks after optic nerve crush. Three of the transcripts (Hsp27, Bim, and Gap43) are indicative of ganglion cell stress responses. The other three transcripts (Thy1, Sncg, and Nrn1) are indicative of normal healthy adult ganglion cells. The data are represented as the change in transcript abundance between experimental and control samples, and expressed as a percentage of transcript numbers in control samples (mean ± SD of triplicate samples for each target cDNA). After optic nerve crush, wild-type mice exhibit an increase in stress-related gene expression, and a decrease in the mRNAs normally expressed in ganglion cells. Although Bax−/− ganglion cells also exhibit a downregulation of normal gene expression statistically identical to wild-type mice (P > 0.05, for each transcript), stress-related gene expression is dramatically muted (P < 0.001 for each bar). Because there is a dramatic difference in the upregulation of stress response genes relative to downregulated genes, the data are shown using an expanded scale between 0% and ±100% change (blue-shaded region).

References

    1. Nickells RW. Retinal ganglion cell death in glaucoma: the how, the why, and the maybe. J Glaucoma. 1996; 5: 345–356 - PubMed
    1. Nickells RW. From ocular hypertension to ganglion cell death: a theoretical sequence of events leading to glaucoma. Can J Ophthalmol. 2007; 42: 278–287 - PubMed
    1. Morrison JC, Cepurna WO, Jia L, Aubert J, Johnson EC. Mechanism of focal optic nerve injury from elevated intraocular pressure. Invest Ophthalmol Vis Sci. 2002; 43: U813
    1. Morrison JC, Johnson EC, Cepurna WA, Jia L. Understanding mechanisms of pressure-induced optic nerve damage. Prog Retin Eye Res. 2005; 24: 217–240 - PubMed
    1. Johnson EC, Jia L, Cepurna WA, Doser TA, Morrison JC. Global changes in optic nerve head gene expression after exposure to elevated intraocular pressure in a rat glaucoma model. Invest Ophthalmol Vis Sci. 2007; 48: 3161–3177 - PMC - PubMed

Publication types

MeSH terms