Comparative Study
. 2013 Jun;83(6):1169-76.
doi: 10.1038/ki.2013.7. Epub 2013 Feb 20.

Estimating the glomerular filtration rate from serum creatinine is better than from cystatin C for evaluating risk factors associated with chronic kidney disease

Affiliations
Comparative Study

Estimating the glomerular filtration rate from serum creatinine is better than from cystatin C for evaluating risk factors associated with chronic kidney disease

Andrew D Rule et al. Kidney Int. 2013 Jun.

Erratum in

  • Kidney Int. 2013 Aug;84(2):419

Abstract

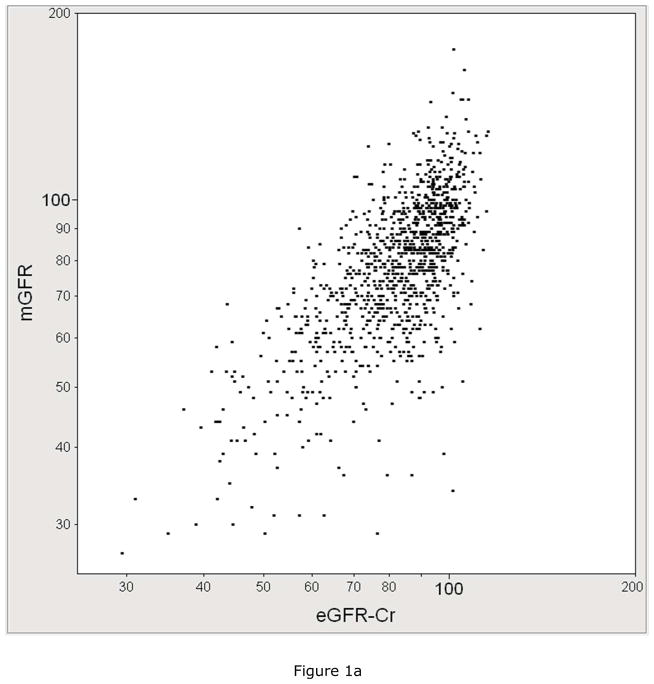
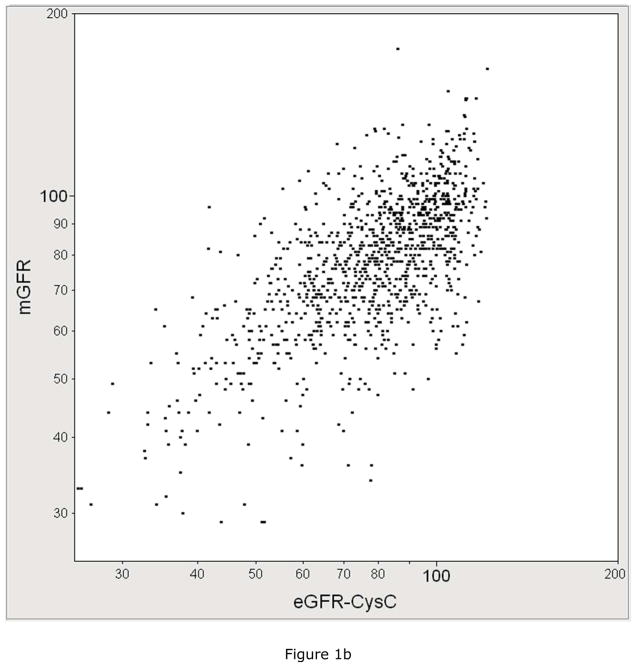
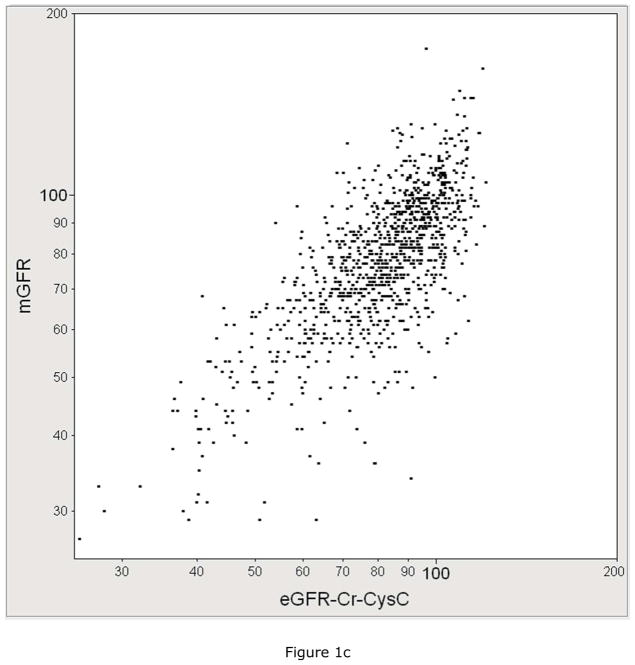
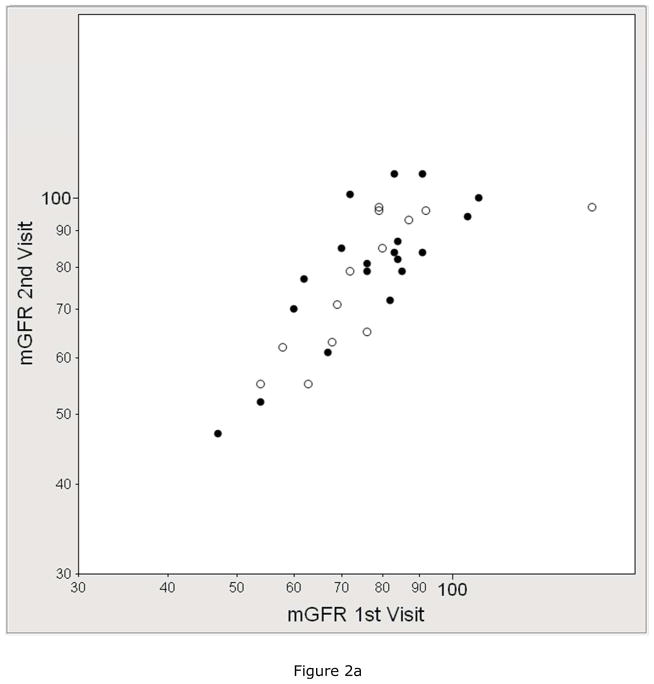
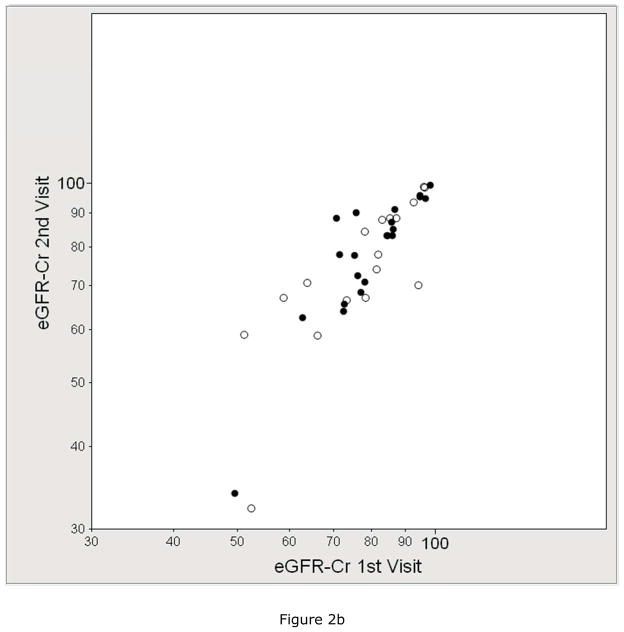
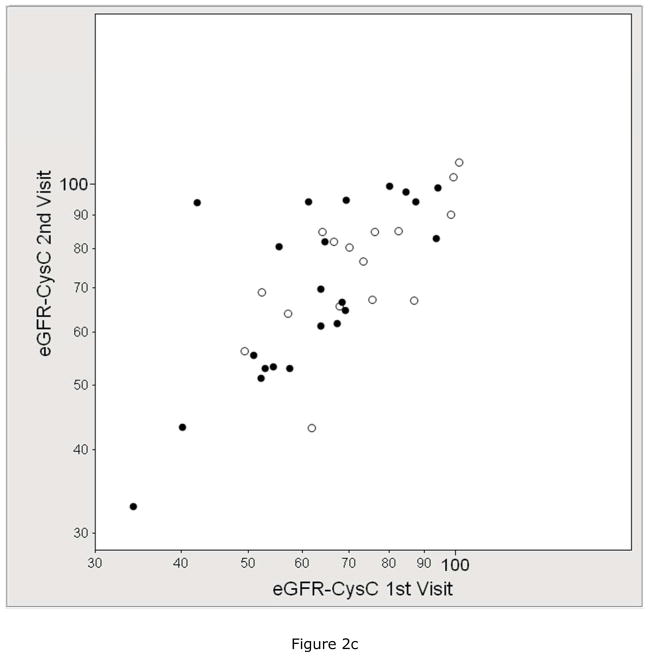
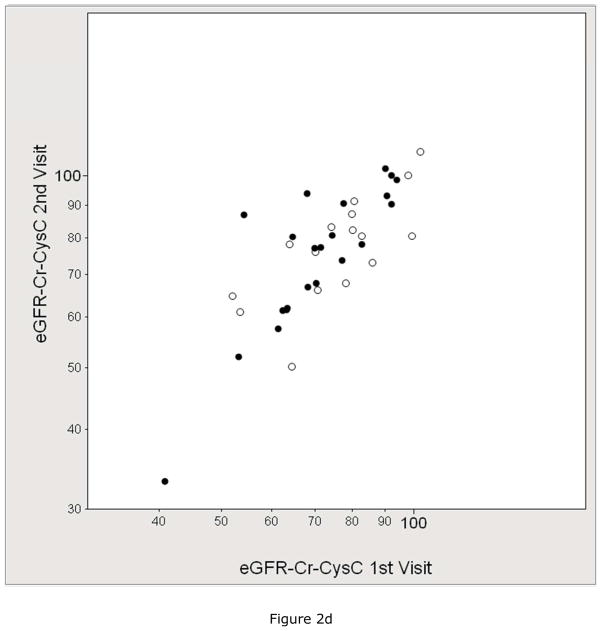
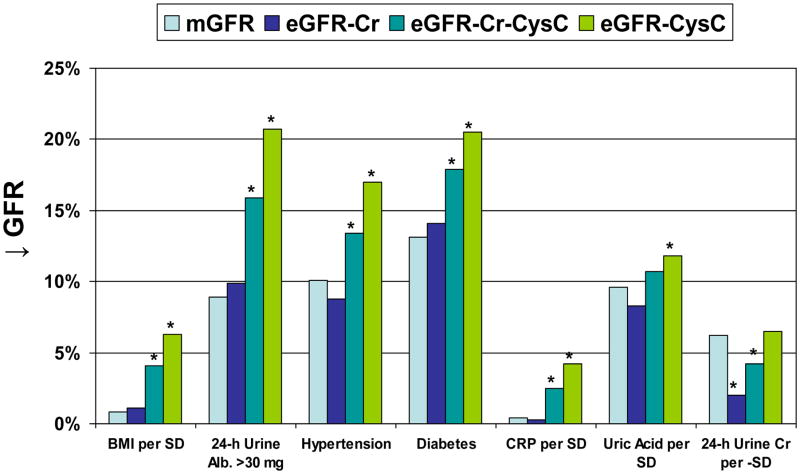
Chronic kidney disease risk factors may associate with the estimated glomerular filtration rate (eGFR) differently than with the measured GFR. To examine this, we evaluated 1150 patients (mean age 65 years) in two community cohorts for risk factors, measured GFR by iothalamate clearance, and eGFR based on creatinine (Cr), cystatin C (CysC), or both. The interaction between each risk factor and eGFR (relative to measured GFR) identified risk factor associations with eGFR along non-GFR pathways. In a subset of 40 patients with two visits, the mean coefficient of variation was 8.2% for measured GFR, 6.4% for eGFRCr, 8.2% for eGFRCr-CysC, and 10.7% for eGFRCysC. The measured GFR was better correlated with eGFRCr-CysC (r, 0.74) than eGFRCr (r, 0.70) or eGFRCysC (r, 0.68). Lower measured GFR associated with lower 24-hour urine creatinine, albuminuria, hypertension, diabetes, higher triglycerides, and higher uric acid. Lower eGFRCr had these same associations except for an association with higher 24-hour urine creatinine along a non-GFR pathway. Lower eGFRCysC and eGFRCr-CysC also had these same associations but also associated with obesity, albuminuria, hypertension, diabetes, higher triglycerides, higher C-reactive protein, and higher uric acid along non-GFR pathways. Thus, cystatin C improves estimation of GFR over creatinine alone; however, the association between most of the risk factors and GFR was more accurate by eGFR based on creatinine alone. This is explained by the association of these risk factors with the non-GFR determinants of cystatin C.


Conflict of interest statement

Disclosure: All the authors declared no competing interests

Figures

Figure 1
Figure 1
The correlation between measured GFR (mGFR, Y-axis) with A) serum creatinine based estimated GFR with the CKD-EPI equation (eGFRCr, X-axis, R=0.70), B) cystatin C based estimated GFR (eGFRCysC, X-axis, R=0.68), C) serum creatinine and cystatin C based estimated GFR(eGFRCCr-CysC, X-axis, R=0.74).
Figure 1
Figure 1
The correlation between measured GFR (mGFR, Y-axis) with A) serum creatinine based estimated GFR with the CKD-EPI equation (eGFRCr, X-axis, R=0.70), B) cystatin C based estimated GFR (eGFRCysC, X-axis, R=0.68), C) serum creatinine and cystatin C based estimated GFR(eGFRCCr-CysC, X-axis, R=0.74).
Figure 2
Figure 2
Reliability between duplicate visits of A) measured GFR (mGFR, r =0.76), B) estimated GFR by serum creatinine (eGFRCr, r =0.84), C) estimated GFR by cystatin C (eGFRCysC, r =0.76), and D) estimated GFR by serum creatinine and cystatin C (eGFRCr-CysC, r =0.82). The solid circle represents the GENOA subjects who were specifically recruited for 2 duplicate study visits (mean 62 days apart). The open circles represent the subjects who had 2 duplicate study visits because they were participants in both the GENOA and ECAC cohorts (mean 296 days apart).
Figure 2
Figure 2
Reliability between duplicate visits of A) measured GFR (mGFR, r =0.76), B) estimated GFR by serum creatinine (eGFRCr, r =0.84), C) estimated GFR by cystatin C (eGFRCysC, r =0.76), and D) estimated GFR by serum creatinine and cystatin C (eGFRCr-CysC, r =0.82). The solid circle represents the GENOA subjects who were specifically recruited for 2 duplicate study visits (mean 62 days apart). The open circles represent the subjects who had 2 duplicate study visits because they were participants in both the GENOA and ECAC cohorts (mean 296 days apart).
Figure 3
Figure 3
The association of CKD risk factors with percentage decrease in GFR (↓ GFR) by each method (mGFR, eGFRCr, eGFRCr-CysC, and eGFRCysC). The * identifies p<0.05 for eGFR compared to mGFR using model 1 (generalized estimating equations). Risk factor associations with mGFR were more similar to those with eGFRCr than with eGFRCr-CysC or eGFRCysC. The one exception was 24-h urine creatinine where eGFRCysC was more similar to the same association with mGFR.

Comment in

References

    1. Peralta CA, Katz R, Sarnak MJ, et al. Cystatin C identifies chronic kidney disease patients at higher risk for complications. J Am Soc Nephrol. 2011;22:147–155. - PMC - PubMed
    1. Peralta CA, Shlipak MG, Judd S, et al. Detection of chronic kidney disease with creatinine, cystatin C, and urine albumin-to-creatinine ratio and association with progression to end-stage renal disease and mortality. Jama. 2011;305:1545–1552. - PMC - PubMed
    1. Inker LA, Schmid CH, Tighiouart H, et al. Estimating glomerular filtration rate from serum creatinine and cystatin C. N Engl J Med. 2012;367:20–29. - PMC - PubMed
    1. Mathisen UD, Melsom T, Ingebretsen OC, et al. Estimated GFR associates with cardiovascular risk factors independently of measured GFR. J Am Soc Nephrol. 2011;22:927–937. - PMC - PubMed
    1. Menon V, Shlipak MG, Wang X, et al. Cystatin C as a risk factor for outcomes in chronic kidney disease. Annals of Internal Medicine. 2007;147:19–27. - PubMed

Publication types

MeSH terms