Review
. 2013 Jul;41(7):1384-98.
doi: 10.1007/s10439-013-0752-3. Epub 2013 Feb 20.

Methods for measuring right ventricular function and hemodynamic coupling with the pulmonary vasculature

Affiliations
Review

Methods for measuring right ventricular function and hemodynamic coupling with the pulmonary vasculature

Alessandro Bellofiore et al. Ann Biomed Eng. 2013 Jul.

Abstract

The right ventricle (RV) is a pulsatile pump, the efficiency of which depends on proper hemodynamic coupling with the compliant pulmonary circulation. The RV and pulmonary circulation exhibit structural and functional differences with the more extensively investigated left ventricle (LV) and systemic circulation. In light of these differences, metrics of LV function and efficiency of coupling to the systemic circulation cannot be used without modification to characterize RV function and efficiency of coupling to the pulmonary circulation. In this article, we review RV physiology and mechanics, established and novel methods for measuring RV function and hemodynamic coupling, and findings from application of these methods to RV function and coupling changes with pulmonary hypertension. We especially focus on non-invasive measurements, as these may represent the future for clinical monitoring of disease progression and the effect of drug therapies.


Figures
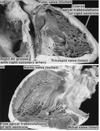
Figure 1
Figure 1
Comparison of the apical trabeculation patterns in the RV (top) and the LV (bottom). Figure from Anderson and Ho.
Figure 2
Figure 2
Sketch of the PV loop in the RV (blue) and LV (red). The pressure variation in the RV is much lower, whereas the two ventricles pump the same SV. The dashed lines are the ESPVR and EDPVR for the RV PV loop.
Figure 3
Figure 3
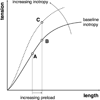
Length-tension diagram for myocardial fibers. The solid line represents the length-tension relationship at baseline inotropy. An increase in maximum fiber elongation at end diastole (preload) produces an increase in fiber tension (from point A to B), resulting in a stronger contraction. If inotropy is increased, the length-tension curve is shifted upward and to the left (dashed line). An increase in inotropy (from point B to C), produces in an increase in fiber tension independent of fiber length.
Figure 4
Figure 4
Representation of heterometric (left and center plot) and homeometric autoregulation (right plot). If preload is increased (left plot) heterometric autoregulation increases SV by the same ΔVed. If afterload is increased, both heterometric and homeometric responses are activated. In heterometric autoregulation (center plot), an increase in EDV (ΔVed) leads to an increase in pressure (ΔPes) with no change in SV and inotropy. In homeometric autoregulation (right plot), a pressure increase (ΔPes) to match increased afterload is achieved by increasing RV contractility (ΔEes) with no change in SV and preload. The baseline loop is sketched in red. The end-systolic pressure-volume relationship (ESPVR) line and the end-diastolic pressure-volume relationship (EDPVR) line define the limits of RV working conditions.
Figure 5
Figure 5
Comparison of the methods to evaluate end-systolic elastance from PV loops. Left plot: multi-beat method. Multiple loops are collected while reducing preload and the ESPVR is obtained as the straight line through all the end-systolic points. The loop at baseline preload is sketched in red color. Center plot: single-beat method. The ESPVR is the straight line through the end-systolic point of the single loop collected and the end-systolic point of an isovolumic beat (EDV, Pmax). Right plot: maximal elastance method. Ees is approximated as the maximum pressure-to-volume ratio reached in a single beat. As a result, the ESPVR is the straight line through the origin and the point of the loop where P/V is largest.
Figure 6
Figure 6
MR images collected 10 minutes after administration of gadolinium contrast in (A) a patient with PAH and (B) a patient with scleroderma but no PH. In the PAH patient, DCE appears as bright areas at the RV free wall insertion points (indicated by the arrows). DCE is absent in the patient without PH. Modified figure from Shehata et al..

References

    1. Abel FL. Fourier Analysis of Left Ventricular Performance Evaluation of Impedance Matching. Circ Res. 1971;28:119–135. - PubMed
    1. Abraham TP, Dimaano VL, Liang H-Y. Role of tissue Doppler and strain echocardiography in current clinical practice. Circulation. 2007;116:2597–2609. - PubMed
    1. Amundsen BH, et al. Noninvasive myocardial strain measurement by speckle tracking echocardiography: validation against sonomicrometry and tagged magnetic resonance imaging. J Am Coll Cardiol. 2006;47:789–793. - PubMed
    1. Anderson RH, Ho SY. What is a ventricle? Ann Thorac Surg. 1998;66:616–620. - PubMed
    1. Antoni ML, et al. Prognostic value of right ventricular function in patients after acute myocardial infarction treated with primary percutaneous coronary intervention. Circ Cardiovasc Imaging. 2010;3:264–271. - PubMed

Publication types