

Validation of nigrostriatal positron emission tomography measures: critical limits
- PMID: 23423933
- PMCID: PMC3631302
- DOI: 10.1002/ana.23798
Validation of nigrostriatal positron emission tomography measures: critical limits
Abstract
Objective: Molecular imaging and clinical endpoints are frequently discordant in Parkinson disease clinical trials, raising questions about validity of these imaging measures to reflect disease severity. We compared striatal uptake for 3 positron emission tomography (PET) tracers with in vitro measures of nigral cell counts and striatal dopamine in 1-methyl-4-phenyl-1,2,3,6-tetrahydropyridine (MPTP)-treated monkeys.
Methods: Sixteen macaques had magnetic resonance imaging and baseline PETs using 6-[18F]fluorodopa (FD), [11C]dihydrotetrabenazine (DTBZ), and 2beta-[11 C]carbomethoxy-3beta-(4-fluorophenyl)tropane (CFT). MPTP (0-0.31 mg/kg) infused unilaterally via the internal carotid artery produced stable hemiparkinsonism by 3 weeks. After 8 weeks, PETs were repeated and animals were euthanized for striatal dopamine measurements and unbiased counts of tyrosine hydroxylase-stained nigral cells.
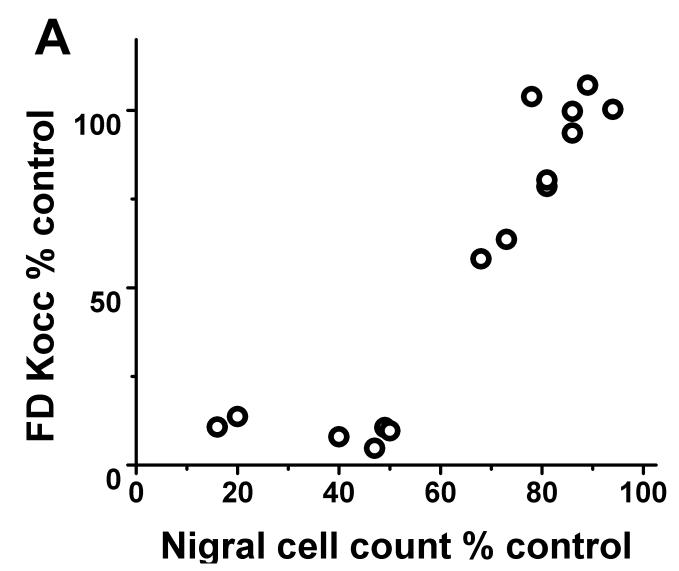
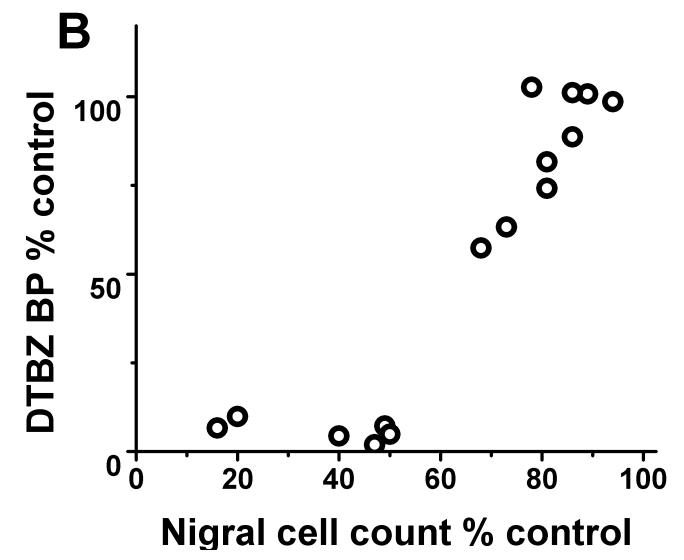
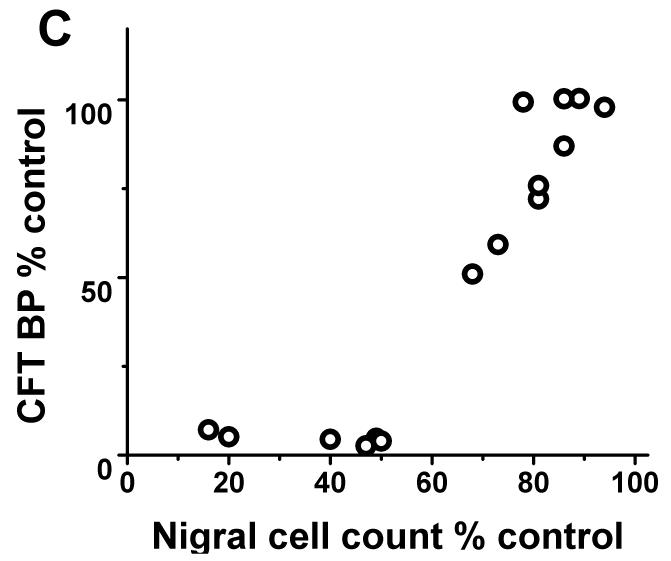
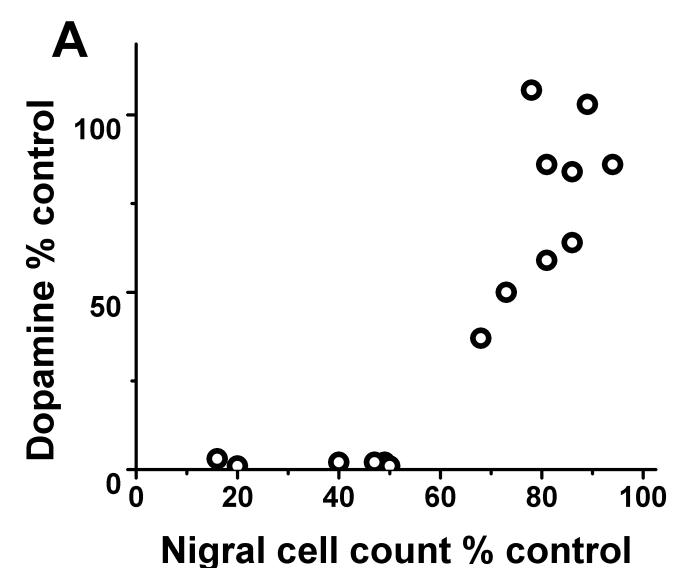
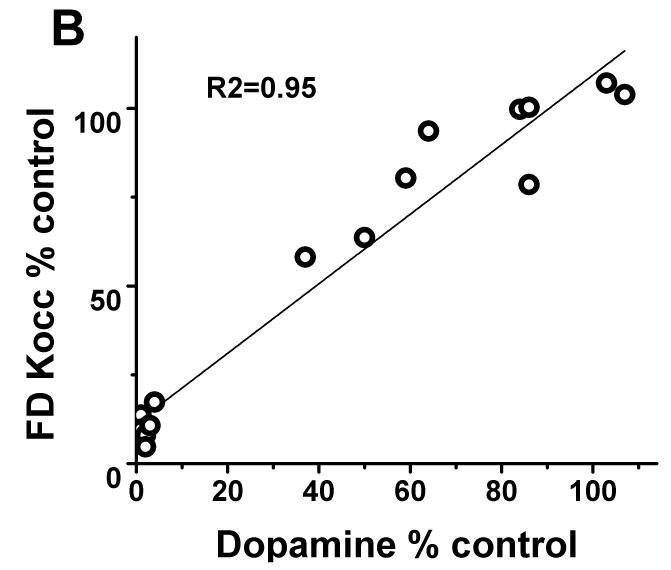
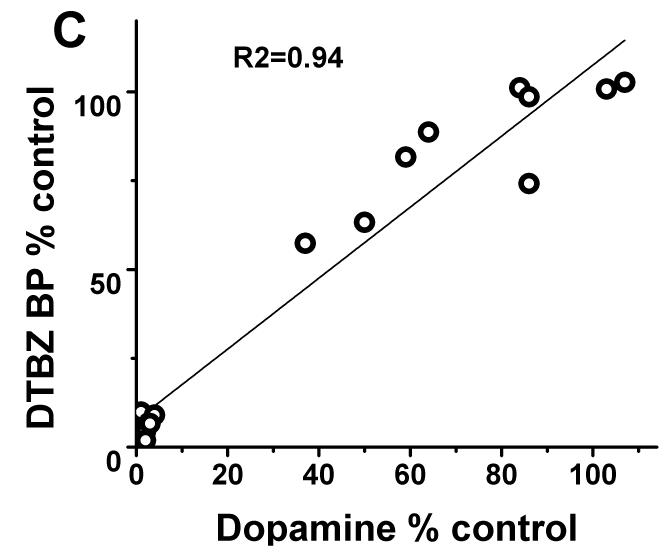
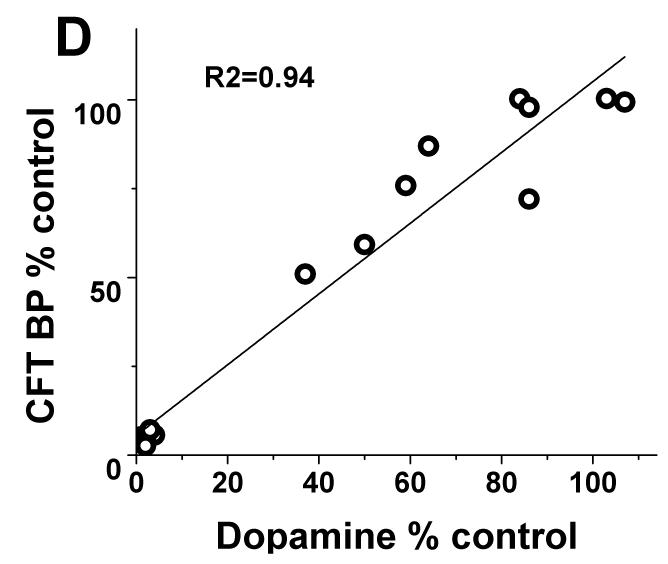
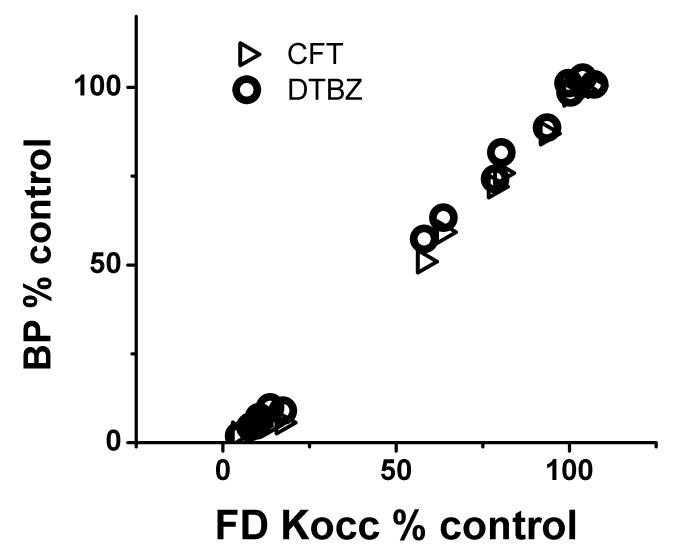
Results: Striatal uptake for each radiotracer (FD, DTBZ, CFT) correlated with stereologic nigral cell counts only for nigral loss<50% (r2=0.84, r2=0.86, r2=0.87, p<0.001 respectively; n=10). In contrast, striatal uptake correlated with striatal dopamine over the full range of dopamine depletion (r2=0.95, r2=0.94, r2=0.94, p<0.001; n=16). Interestingly, indices of striatal uptake of FD, DTBZ, and CFT correlated strongly with each other (r2=0.98, p<0.001).
Interpretation: Tracer uptake correlated with nigral neurons only when nigral loss was <50%. This along with previous work demonstrating that nigral cell counts correlate strongly with parkinsonism ratings may explain discordant results between neuroimaging and clinical endpoints. Furthermore, strong correlations among striatal uptake for these tracers support lack of differential regulation of decarboxylase activity (FD), vesicular monoamine transporter type 2 (DTBZ), and dopamine transporter (CFT) within 2 months after nigrostriatal injury.
Copyright © 2013 American Neurological Association.
Figures
References
-
- Brooks DJ, Frey KA, Marek KL, et al. Assessment of neuroimaging techniques as biomarkers of the progression of Parkinson’s disease. Exp.Neurol. 2003;184(Suppl 1):S68–S79. - PubMed
-
- Fahn S, Oakes D, Shoulson I, et al. Levodopa and the progression of Parkinson’s disease. N.Engl.J.Med. 2004;351:2498–508. - PubMed
-
- Ravina B, Eidelberg D, Ahlskog JE, et al. The role of radiotracer imaging in Parkinson disease. Neurology. 2005;64:208–15. - PubMed
-
- Biglan KM, Holloway RG. Surrogate endpoints in Parkinson’s disease research. Curr.Neurol.Neurosci.Rep. 2003;3:314–20. - PubMed
-
- Dorsey ER, Holloway RG, Ravina BM. Biomarkers in Parkinson’s disease. Expert.Rev.Neurother. 2006;6:823–31. - PubMed
Publication types
MeSH terms
Substances
Grants and funding
LinkOut - more resources
Full Text Sources
Other Literature Sources
