. 2013 Feb 19:7:1.
doi: 10.3389/fnana.2013.00001. eCollection 2013.

Computing the size and number of neuronal clusters in local circuits

Affiliations

Computing the size and number of neuronal clusters in local circuits

Rodrigo Perin et al. Front Neuroanat. .

Abstract

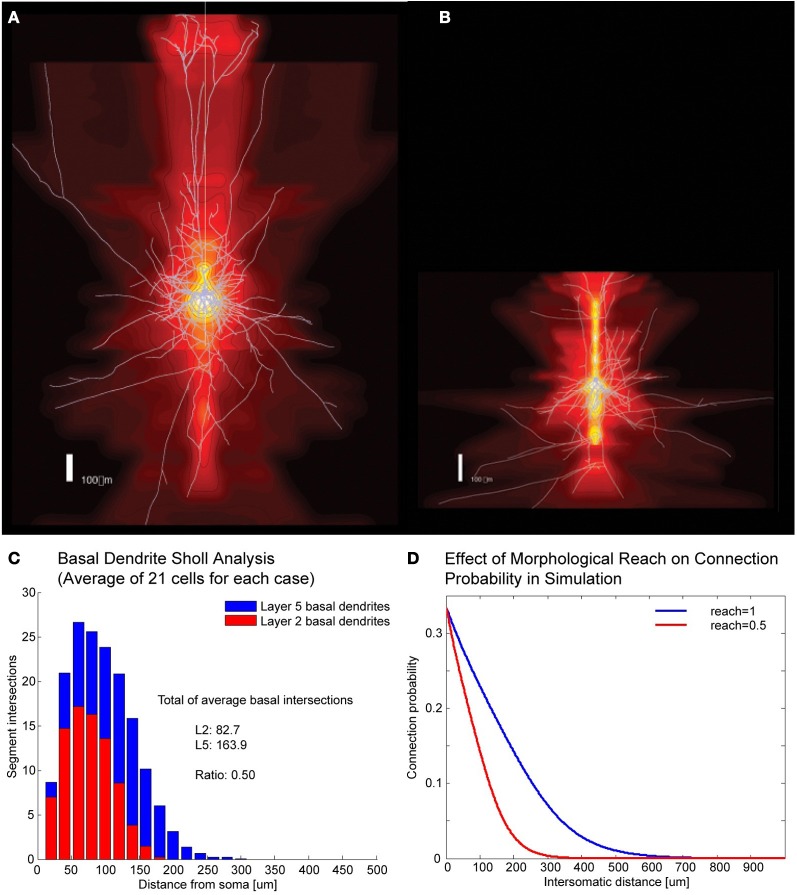
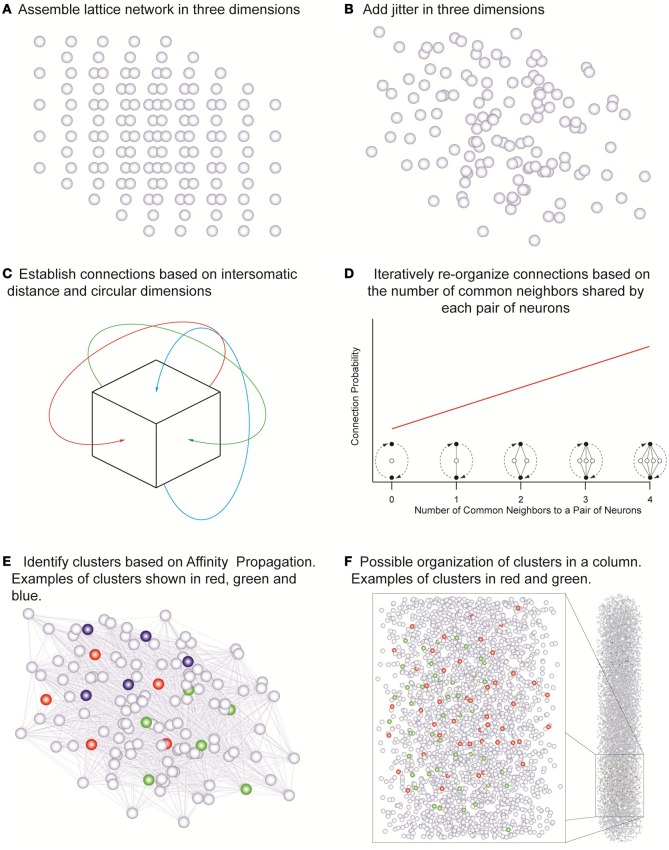
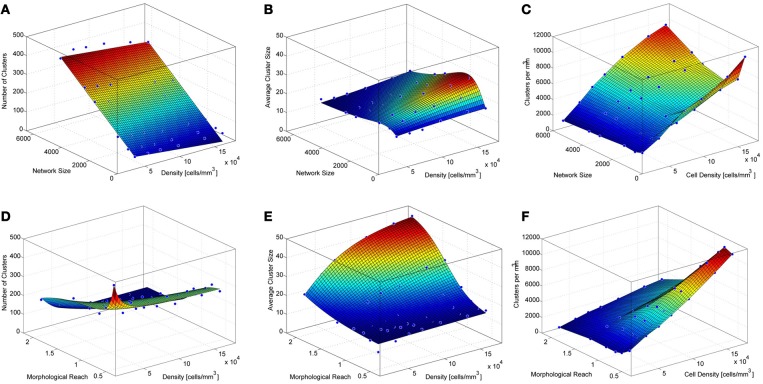
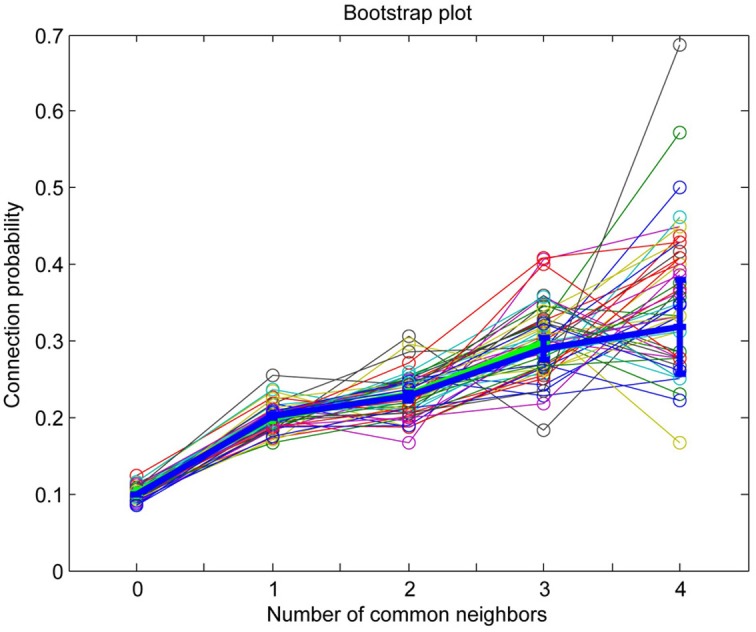
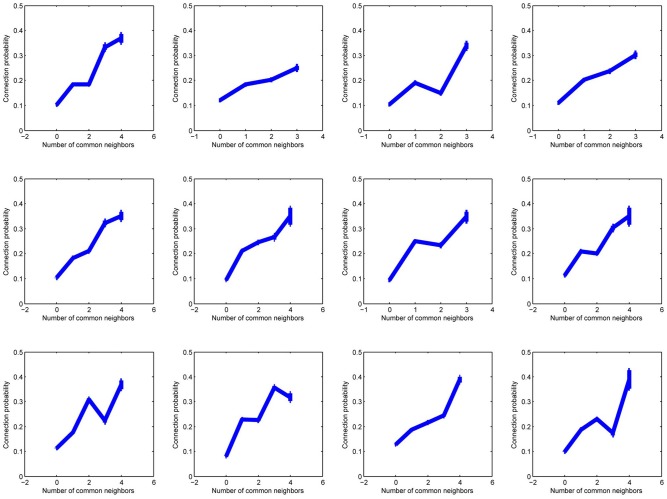
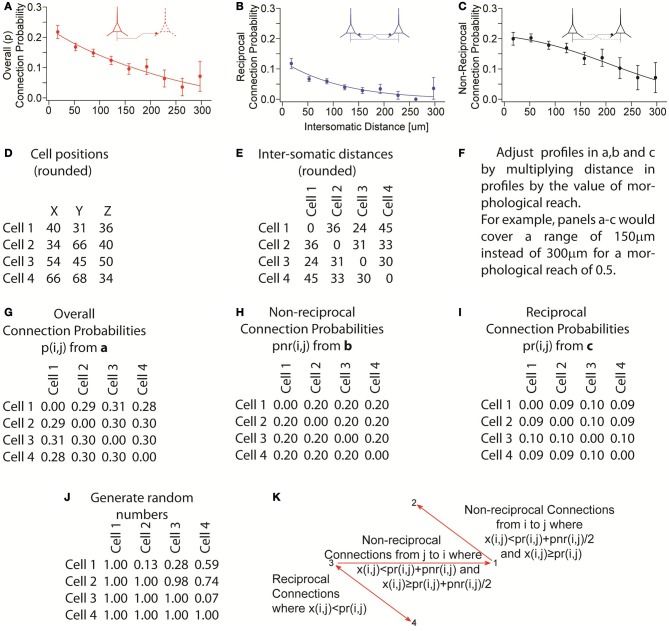
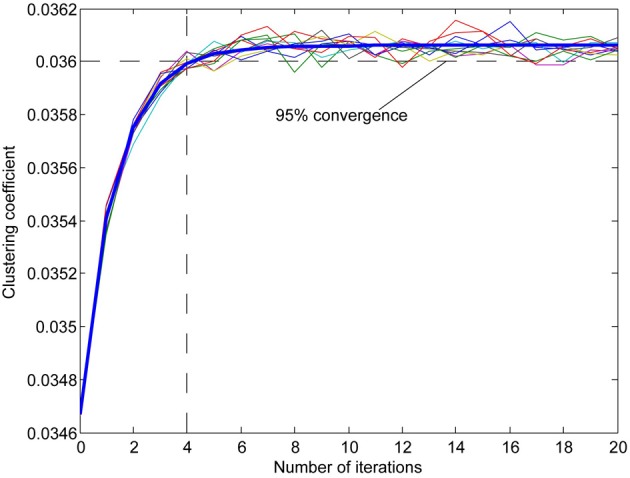
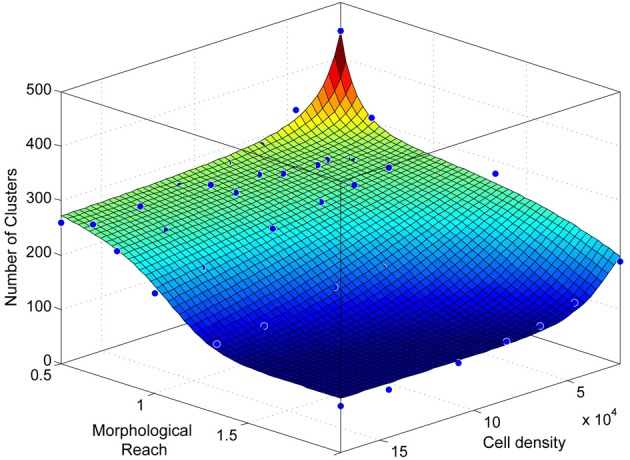
The organization of connectivity in neuronal networks is fundamental to understanding the activity and function of neural networks and information processing in the brain. Recent studies show that the neocortex is not only organized in columns and layers but also, within these, into synaptically connected clusters of neurons (Ko et al., 2011; Perin et al., 2011). The recently discovered common neighbor rule, according to which the probability of any two neurons being synaptically connected grows with the number of their common neighbors, is an organizing principle for this local clustering. Here we investigated the theoretical constraints for how the spatial extent of neuronal axonal and dendritic arborization, heretofore described by morphological reach, the density of neurons and the size of the network determine cluster size and numbers within neural networks constructed according to the common neighbor rule. In the formulation we developed, morphological reach, cell density, and network size are sufficient to estimate how many neurons, on average, occur in a cluster and how many clusters exist in a given network. We find that cluster sizes do not grow indefinitely as network parameters increase, but tend to characteristic limiting values.

Keywords: clustering; data driven modeling; layer 2 pyramidal cell; layer 5 pyramidal cell; neuronal assemblies.


Figures

Figure 1
Figure 1
Correlates of different cell types. (A,B) Example of Layer V Pyramidal Cell and Layer II/III Pyramidal Cell morphologies, respectively, superposed on intensity maps representing the average density of morphological processes around the soma. (C) Sholl analysis of the basal dendrites of Layer V and Layer II/III. (D) Illustration of how morphological reach is used to modify connection probabilities as a function of inter-somatic distance in simulations.
Figure 2
Figure 2
The network assembly and reorganization of connections. (A) Initial lattice arrangement of somas. (B) Jitter added in three dimensions to the lattice arrangement. (C) Connections assigned according to intersomatic distance probability profiles in circular dimensions in order to eliminate boundary effects. (D) Iterative reorganization of connections based on numbers of common neighbors. (E) Cluster identification based on affinity propagation. (F) Possible organization of clusters in a column with examples of clusters sharing the same space.
Figure 3
Figure 3
Properties of simulated cortical network clustering. (A) Average number of clusters observed in the different simulations as a function of network size and density. Each data point corresponds to the average of 10 simulations. (B) Average cluster size for the same simulations show in A. (C) Number of clusters per mm3 calculated from A and B. (D) Average number of clusters observed in the different simulations as a function of network density and morphological reach. Each green data point corresponds to the average of 10 simulations. (E) Average cluster size for the same simulations show in D. (F) Number of clusters per mm3 calculated from D and E.
Figure A1
Figure A1
MatLab bootstrap analysis of connection probability as a function of the number of common neighbors (thin lines in various colors) with original data mean and standard error of the mean superposed for reference (thick blue line).
Figure A2
Figure A2
Twelve plots of connection probability as a function of the number of common neighbors in subsets of 20 experiments, each experiment from a different individual.
Figure A3
Figure A3
Process illustrating assembly of pseudo-random networks that respect the overall connection probability as a function of distance as well as the non-reciprocal and reciprocal connection probabilities as a function of distance. (A–C) Experimentally observed connection probability profiles and fitted functions (sigmoids). (D) Example of cell positions generated by grid plus random jitter. (E) Calculated intersomatic distances from D. (F) Apply morphological reach as a factor in the connection probability profile. (G–I) Connection probabilities, given a morphological reach of 1, used for the remainder of the example. (J) Generate random numbers x(i, j) once for each pair of neurons i and j. (K) Determine presence and direction of connections based on random numbers that were generated. Reciprocal connections occur where x(i, j) < pr(i, j). Non-reciprocal connections from neuron i to neuron j occur where x(i, j) ≥ pr(i, j) and x(i, j) < pr(i, j) + pnr(i, j)/2. Non-reciprocal connections occur from neuron j to neuron i where x(i, j) ≥ pr(i, j) + pnr(i, j)/2 and x(i, j) < pr(i, j) + pnr(i, j). No connections are formed when x(i, j) ≥ pr(i, j) + pnr(i, j). The overall probability of connection p always respects its distance profile and the equation p(i, j) = pr(i, j) + pnr(i, j)/2.
Figure A4
Figure A4
Examples of the effect of reorganization on clustering coefficient of a network (multiple thin lines) with a fitted exponential curve (thick blue line). Since the computation of the clustering coefficient is time-consuming we used the number of iterations that best approximated 95% percent convergence to the value projected after infinite iterations (from fitted data). The clustering coefficient is the measure of the probability of connection among each neuron's neighbors calculated for each neuron in the network.
Figure A5
Figure A5
Number of clusters as a function of network density and morphological reach as in Figure 3D, viewed from a different angle.

References

    1. Barabási A.-L., Albert R. (1999). Emergence of scaling in random networks. Science 286, 509–512 10.1126/science.286.5439.509 - DOI - PubMed
    1. Bohland J. W., Wu C., Barbas H., Bokil H., Bota M., Breiter H. C., et al. (2009). A proposal for a coordinated effort for the determination of brainwide neuroanatomical connectivity in model organisms at a mesoscopic scale. PLoS Comput. Biol. 5:e1000334 10.1371/journal.pcbi.1000334 - DOI - PMC - PubMed
    1. Brown S. P., Hestrin S. (2009). Intracortical circuits of pyramidal neurons reflect their long-range axonal targets. Nature 457, 1133–1136 10.1038/nature07658 - DOI - PMC - PubMed
    1. Erdõs P., Rényi A. (1960). On the evolution of random graphs. Publ. Math. Inst. Hung. Acad. Sci. 5, 17–61
    1. Frey B. J., Dueck D. (2007). Clustering by passing messages between data points. Science 315, 972–976 10.1126/science.1136800 - DOI - PubMed