

Higher frequencies of GARP(+)CTLA-4(+)Foxp3(+) T regulatory cells and myeloid-derived suppressor cells in hepatocellular carcinoma patients are associated with impaired T-cell functionality
- PMID: 23423978
- PMCID: PMC3645275
- DOI: 10.1158/0008-5472.CAN-12-3381
Higher frequencies of GARP(+)CTLA-4(+)Foxp3(+) T regulatory cells and myeloid-derived suppressor cells in hepatocellular carcinoma patients are associated with impaired T-cell functionality
Abstract
The extent to which T-cell-mediated immune surveillance is impaired in human cancer remains a question of major importance, given its potential impact on the development of generalized treatments of advanced disease where the highest degree of heterogeneity exists. Here, we report the first global analysis of immune dysfunction in patients with advanced hepatocellular carcinoma (HCC). Using multi-parameter fluorescence-activated cell sorting analysis, we quantified the cumulative frequency of regulatory T cells (Treg), exhausted CD4(+) helper T cells, and myeloid-derived suppressor cells (MDSC) to gain concurrent views on the overall level of immune dysfunction in these inoperable patients. We documented augmented numbers of Tregs, MDSC, PD-1(+)-exhausted T cells, and increased levels of immunosuppressive cytokines in patients with HCC, compared with normal controls, revealing a network of potential mechanisms of immune dysregulation in patients with HCC. In dampening T-cell-mediated antitumor immunity, we hypothesized that these processes may facilitate HCC progression and thwart the efficacy of immunotherapeutic interventions. In testing this hypothesis, we showed that combined regimens to deplete Tregs, MDSC, and PD-1(+) T cells in patients with advanced HCC restored production of granzyme B by CD8(+) T cells, reaching levels observed in normal controls and also modestly increased the number of IFN-γ producing CD4(+) T cells. These clinical findings encourage efforts to restore T-cell function in patients with advanced stage disease by highlighting combined approaches to deplete endogenous suppressor cell populations that can also expand effector T-cell populations.
©2013 AACR.
Conflict of interest statement
None of the authors have any conflict of interest.
Figures
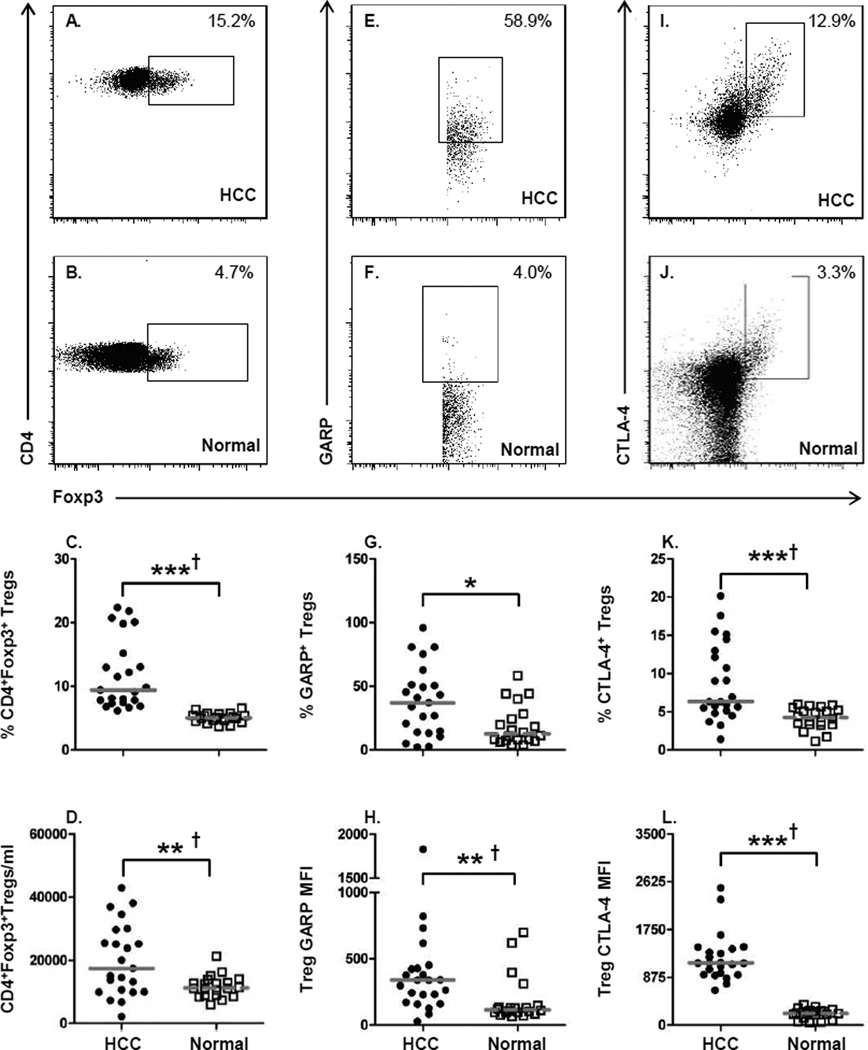
 ) or normal healthy subjects (
 ); lines represent median
values for the group. * P < 0.05, ** P < 0.01, ***
P < 0.001, Mann-Whitney U test; † P < 0.05
Hochberg adjustment for multiple comparison.
); lines represent median
values for the group. * P < 0.05, ** P < 0.01, ***
P < 0.001, Mann-Whitney U test; † P < 0.05
Hochberg adjustment for multiple comparison.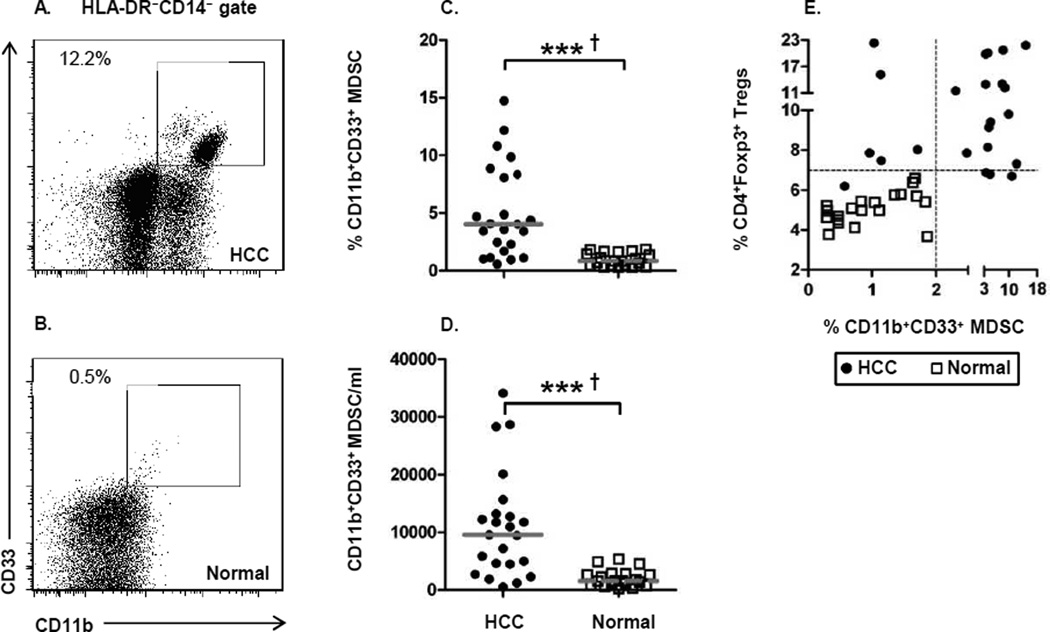 ) or normal
healthy subjects (); lines represent median values for the group. * P
< 0.05, ** P < 0.01, *** P < 0.001,
Mann-Whitney U test; † P < 0.05 Hochberg adjustment for multiple
comparison.
) or normal
healthy subjects (); lines represent median values for the group. * P
< 0.05, ** P < 0.01, *** P < 0.001,
Mann-Whitney U test; † P < 0.05 Hochberg adjustment for multiple
comparison.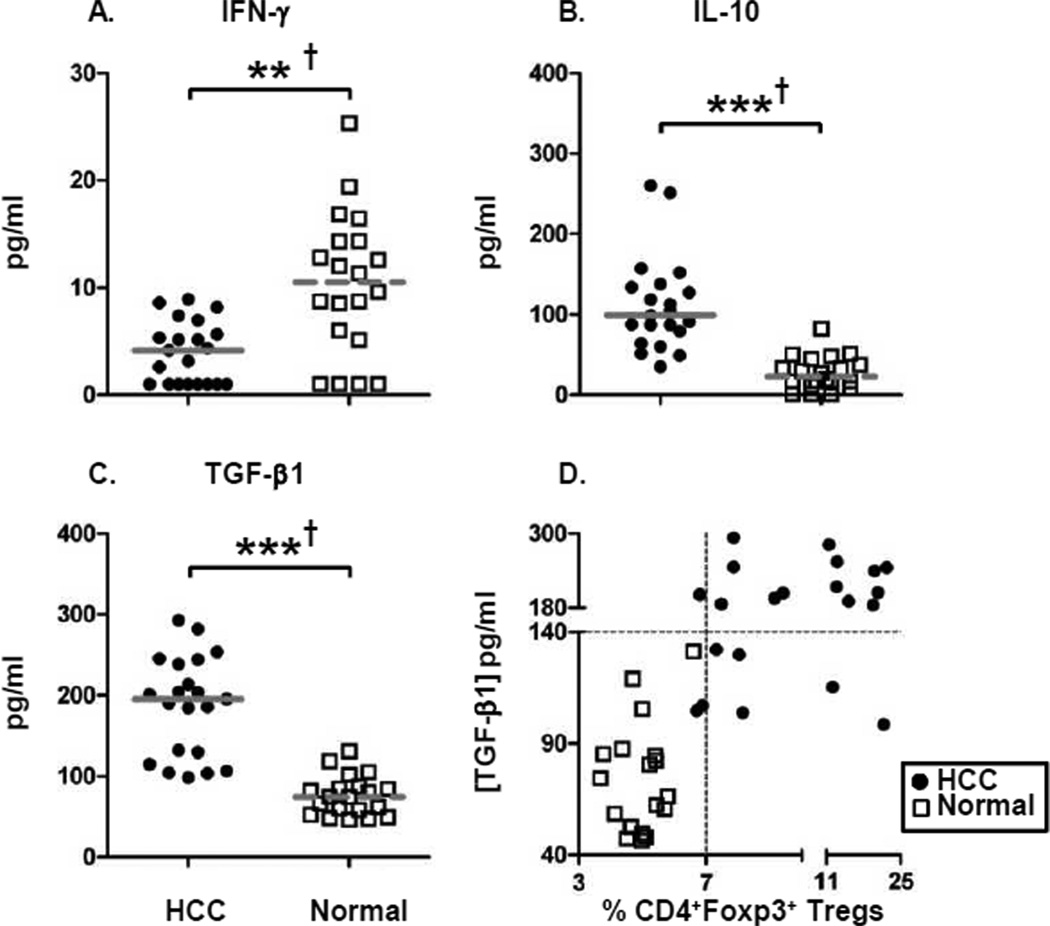 )
or normal healthy subjects (); lines represent median values for the group. ** P
< 0.01, *** P < 0.001, Mann-Whitney U test; †
P < 0.05 Hochberg adjustment for multiple comparison.
)
or normal healthy subjects (); lines represent median values for the group. ** P
< 0.01, *** P < 0.001, Mann-Whitney U test; †
P < 0.05 Hochberg adjustment for multiple comparison.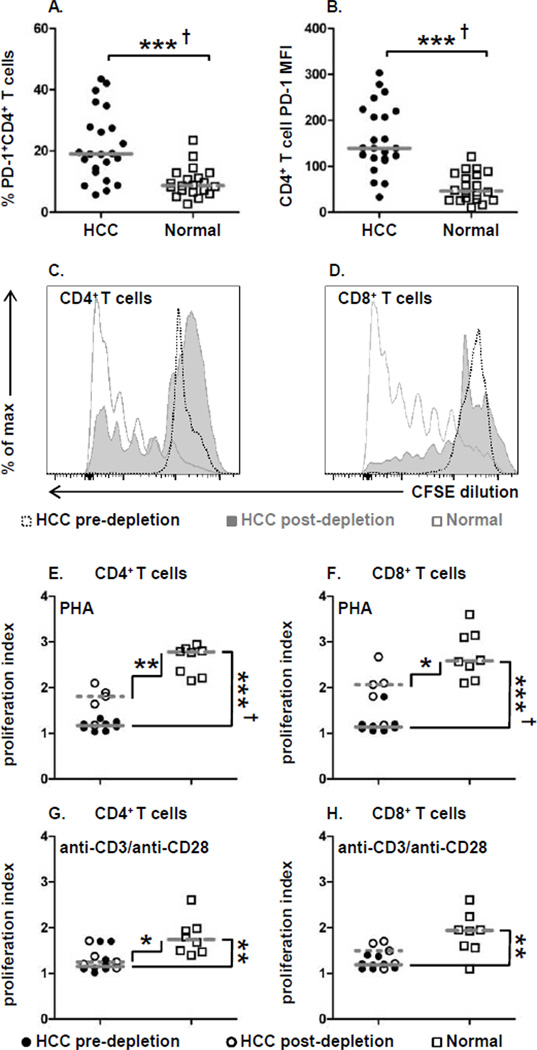 ) and post-depletion (
 ) of suppressor cells and a
normal healthy donor (). (E) CD4+ T cell and (F)
CD8+ T cell proliferation index for PHA and (G) CD4+ T cell and
(H) CD8+ T cell proliferation index for anti-CD3/anti-CD28 stimulation. Each
symbol represents an individual HCC patient pre-depletion (), post-depletion
(
) of suppressor cells and a
normal healthy donor (). (E) CD4+ T cell and (F)
CD8+ T cell proliferation index for PHA and (G) CD4+ T cell and
(H) CD8+ T cell proliferation index for anti-CD3/anti-CD28 stimulation. Each
symbol represents an individual HCC patient pre-depletion (), post-depletion
( ), or
normal healthy subjects (); lines represent median values for the group. * P
< 0.05, ** P < 0.01, *** P < 0.001,
Mann-Whitney U test; † P < 0.05 Hochberg adjustment for multiple
comparison.
), or
normal healthy subjects (); lines represent median values for the group. * P
< 0.05, ** P < 0.01, *** P < 0.001,
Mann-Whitney U test; † P < 0.05 Hochberg adjustment for multiple
comparison.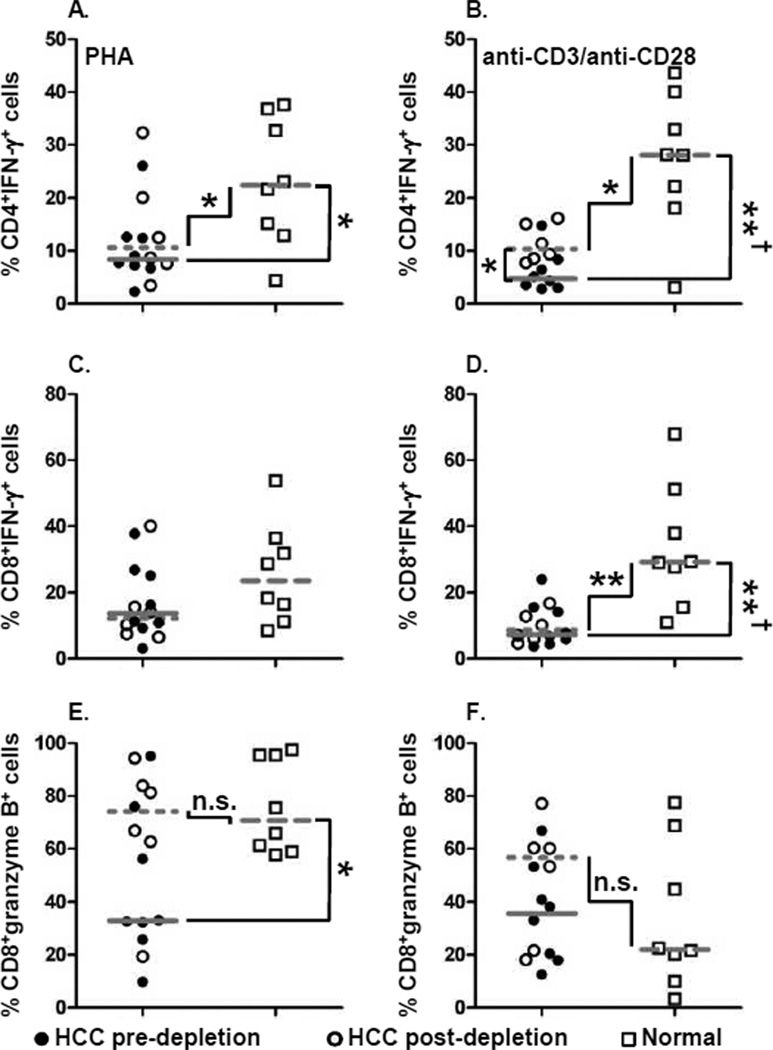 ), post-depletion (), or normal healthy
subjects ();
lines represent median values for the group. n.s. not significant, * P <
0.05, ** P < 0.01, Mann-Whitney U test; † P
< 0.05 Hochberg adjustment for multiple comparison.
), post-depletion (), or normal healthy
subjects ();
lines represent median values for the group. n.s. not significant, * P <
0.05, ** P < 0.01, Mann-Whitney U test; † P
< 0.05 Hochberg adjustment for multiple comparison.References
-
- Jemal A, Siegel R, Xu J, Ward E. Cancer statistics, 2010. CA Cancer J Clin. 2010;60:277–300. - PubMed
-
- Yee C, Riddell SR, Greenberg PD. Prospects for adoptive T cell therapy. Curr Opin Immunol. 1997;9:702–708. - PubMed
-
- Pardoll D. Does the immune system see tumors as foreign or self? Annu Rev Immunol. 2003;21:807–839. - PubMed
-
- Curiel TJ, Coukos G, Zou L, Alvarez X, Cheng P, Mottram P, et al. Specific recruitment of regulatory T cells in ovarian carcinoma fosters immune privilege and predicts reduced survival. Nat Med. 2004;10:942–949. - PubMed
-
- Kobayashi N, Hiraoka N, Yamagami W, Ojima H, Kanai Y, Kosuge T, et al. FOXP3+ regulatory T cells affect the development and progression of hepatocarcinogenesis. Clin Cancer Res. 2007;13:902–911. - PubMed
Publication types
MeSH terms
Substances
Grants and funding
LinkOut - more resources
Full Text Sources
Other Literature Sources
Medical
Research Materials
