. 2013 Feb;25(2):545-57.
doi: 10.1105/tpc.112.108274. Epub 2013 Feb 19.

A dual strategy to cope with high light in Chlamydomonas reinhardtii

Affiliations

A dual strategy to cope with high light in Chlamydomonas reinhardtii

Guillaume Allorent et al. Plant Cell. 2013 Feb.

Abstract

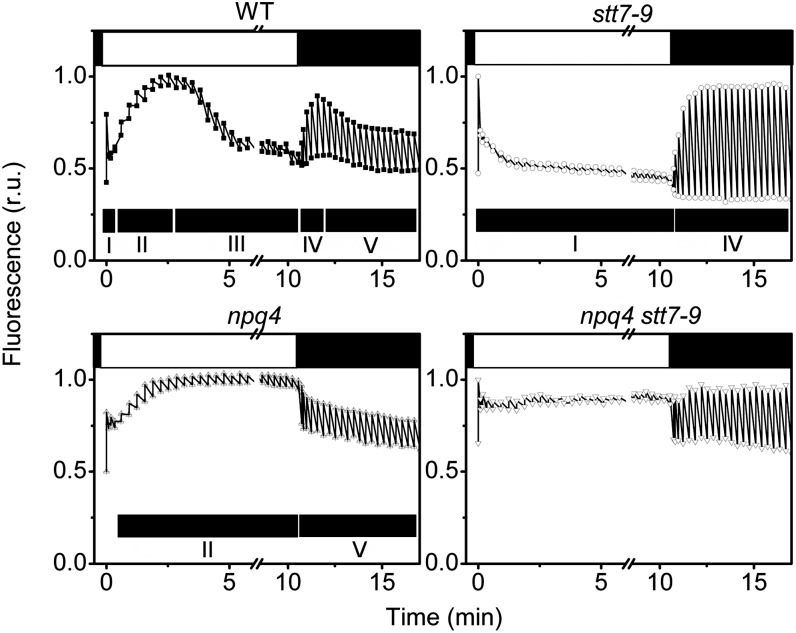
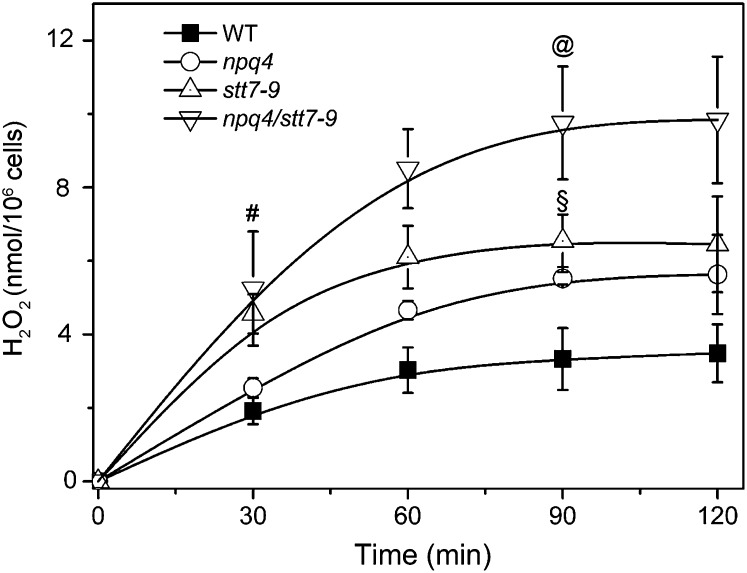
Absorption of light in excess of the capacity for photosynthetic electron transport is damaging to photosynthetic organisms. Several mechanisms exist to avoid photodamage, which are collectively referred to as nonphotochemical quenching. This term comprises at least two major processes. State transitions (qT) represent changes in the relative antenna sizes of photosystems II and I. High energy quenching (qE) is the increased thermal dissipation of light energy triggered by lumen acidification. To investigate the respective roles of qE and qT in photoprotection, a mutant (npq4 stt7-9) was generated in Chlamydomonas reinhardtii by crossing the state transition-deficient mutant (stt7-9) with a strain having a largely reduced qE capacity (npq4). The comparative phenotypic analysis of the wild type, single mutants, and double mutants reveals that both state transitions and qE are induced by high light. Moreover, the double mutant exhibits an increased photosensitivity with respect to the single mutants and the wild type. Therefore, we suggest that besides qE, state transitions also play a photoprotective role during high light acclimation of the cells, most likely by decreasing hydrogen peroxide production. These results are discussed in terms of the relative photoprotective benefit related to thermal dissipation of excess light and/or to the physical displacement of antennas from photosystem II.


Figures

Figure 1.
Figure 1.
State Transition Phenotype of the Different Strains. Cells were harvested in the exponential phase and resuspended in minimum HS medium at a concentration of 2 × 10⁷ cells mL−1. r.u., relative units. (A) Fluorescence induction curves. Traces were recorded in the presence of 10 µM DCMU, in the wild type (WT), stt7-9 (lacking the STT7 kinase), npq4 (lacking LHCSR3), and npq4 stt7-9 clones. Strains were placed either in state 1 (solid squares) or in state 2 (open circles) conditions by placing them in darkness under strong aeration (for state 1) or by incubating them with 5 µM FCCP in the dark for 20 min (for state 2). A decrease of the Fm level under state 2 conditions is indicative of a decrease in the size of the PSII antenna due to LHCII migration to PSI. Similar results were obtained when cells were placed in state 1 by illumination in the presence of 20 µM DCMU. (B) Low-temperature (77 K) fluorescence emission spectra of cells under state 1 (closed squares) and state 2 (open circles) inducing conditions. A high ratio between the fluorescence emission band at 715 nm (PSI) and at 685 nm + 695 nm (PSII) is indicative of a transition to state 2 due to enhanced energy collection by PSI, following LHCII migration from PSII. PSII emission was normalized to 1 in all genotypes.
Figure 2.
Figure 2.
NPQ Induction in Wild-Type, stt7-9, npq4, and npq4 stt7-9 Strains. Cells were harvested in the exponential phase and resuspended in minimum HS medium at a concentration of 2 × 10⁷ cells mL−1. WT, the wild type. (A) NPQ efficiency. Cells were exposed to high light (500 µmol photons m−2 s−1, white light) without external carbon dioxide addition for the indicated times and then briefly (10 min) dark adapted. NPQ capacity was evaluated from the (Fm − Fm′)/Fm′ parameter (Bilger and Björkman, 1990) using a fast imaging setup. Values represent mean ± se (n = 4 biological replicates). (B) LHCSR accumulation. Cells were harvested at the indicated times, and samples were analyzed by immunoblotting with an anti-LHCSR antibody. ATPB (β-subunit of the CF0Fi ATPase) is shown as loading control. One microgram of chlorophyll was loaded in each lane.
Figure 3.
Figure 3.
Pigment Composition of the Different Strains in the Dark and after High-Light Exposure. (A) Carotenoids and α-tocopherol content. C. reinhardtii cells were grown as described in Methods and harvested either in the dark or after high-light (500 µmol photos m−2 s−1, white light) exposure for 4 h. The cells were centrifuged and the pellet was resuspended in methanol. After three consecutive extractions, the supernatant was used to estimate pigment content by HPLC analysis. DES indicates the deepoxidation ratio ([zeaxanthin] + 1/2 [antheraxanthin])/([zeaxanthin] + [antheraxanthin] + [violaxanthin]). α-Tocopherol content is expressed as relative units (r.u.; after normalization to the lutein content). Values represent mean ± se (n = 3 biological replicates). WT, the wild type. (B) Cellular chlorophyll (Chl) a+b content in dark and high light–treated cells. Values represent mean ± se (n = 4 to 6 biological replicates). Statistical comparison was performed using one-way analysis of variance (ANOVA) followed by the Tukey multiple comparison test (P < 0.05). Symbols in the graph denote significant differences: #, between light and dark; §, from the wild type, npq4, and stt7-9.
Figure 4.
Figure 4.
Protein Phosphorylation and State Transition Phenotype in Wild-Type, stt7, npq4, and npq4 stt7-9 Mutant Cells upon High-Light Treatments. Cells were harvested in the exponential phase and resuspended in minimum HS medium. They were exposed to high light (500 µmol of photons m−2 s−1, white light) for 4 h and then briefly (15 min) dark adapted. WT, the wild type. (A) Phosphorylation status of the PSII antennae, including CP26, CP29, and LHCII type I (LhcbM3/-4/-6/-8/-9) in high light–treated cells. Protein phosphorylation was measured by immunoblotting with antiphosphothreonine antibody. Cells were shock frozen at the time of sampling and pelleted by centrifugation before protein extraction. Total proteins from the 2 × 10⁶ cells were loaded in each lane. (B) Low-temperature (77 K) fluorescence emission spectra in high light–treated cells. A high ratio between the fluorescence emission band at 715 nm (PSI) and at 685 nm + 695 nm (PSII) is indicative of a transition to state 2 due to enhanced energy collection by PSI, following LHCII migration from PSII. PSII emission was normalized to 1 in all genotypes. r.u., relative units.
Figure 5.
Figure 5.
Fluorescence Dynamics in High Light–Treated C. reinhardtii Cells. Cells were harvested in the exponential phase and resuspended in minimum HS medium at a cell concentration of 2 × 10⁷ mL−1. They were exposed to high light (500 µmol of photons m−2 s−1, white light) for 4 h and then briefly (15 min) dark adapted before measuring their fluorescence dynamics upon exposure to actinic light (700 µmol photons m−2 s−1, λ = 520 nm). Closed box, dark; open box, actinic light on. Spikes represent maximum fluorescence emission achieved upon illumination with saturating pulses. Black bars indicate phases I through V. See text for more details. r.u., relative units; WT, the wild type.
Figure 6.
Figure 6.
LHCSR3 Migrates between PSII and PSI during State Transitions. Cells were placed either in state 1 (S1; 20 µM DCMU) or in state 2 (S2; 5 µM FCCP in the dark) conditions immediately after high-light incubation (500 µmol photons m−2 s−1, white light) for 4 h. PSI and PSII supercomplexes were isolated as described in Methods, and their protein composition was tested by immunoblotting with the specific antibodies. PSII-His and PSI-His supercomplex proteins (0.5 µg) were loaded in the respective lanes. Cyt, cytochrome.
Figure 7.
Figure 7.
PSI and PSII Activities in Wild-Type, npq4, stt7-9, and npq4 stt7-9 Cells. Cells were harvested in the exponential phase and resuspended in minimum HS medium at a cell concentration of 2 × 10⁷ mL−1. WT, the wild type. Black columns, dark-adapted cells; gray columns, cells exposed to high light (500 µmol photons m−2 s−1, white light) for 4 h and then shortly (10 min) dark adapted. Values represent means ± se (n = 3 to 6 biological replicates). Statistical comparison was performed using one-way ANOVA followed by the Tukey multiple comparison test (P < 0.05). Symbols in the graph denote significant differences: #, from the wild type; §, from the wild type, npq4, and stt7-9. (A) PSII efficiency. PSII quantum yield was monitored as Fv/Fm using an imaging fluorescence setup. (B) Functional PSII:PSI ratio from the ECS signal. PSII and PSI activities were measured as described in Methods.
Figure 8.
Figure 8.
H2O2 Production during High-Light Exposure of C. reinhardtii Cells. Cells were harvested in the exponential phase and resuspended in minimum HS medium at a concentration of 5 × 10⁶ cells mL−1. They were exposed to high light (500 µmol of photons m−2 s−1, white light), and samples were collected at different time points. H2O2 production was assessed as described in Methods. Values represent means ± se (n = 4 to 6 biological replicates). Statistical comparison was performed using one-way ANOVA followed by the Tukey multiple comparison test (P < 0.05). Symbols in the graph denote significant differences: #, from stt7-9 and npq4-stt7-9; §, from the wild type and npq4 stt7-9; @, from the wild type, npq4, and npq4 stt7-9. WT, the wild type.

References

    1. Alboresi A., Gerotto C., Giacometti G.M., Bassi R., Morosinotto T. (2010). Physcomitrella patens mutants affected on heat dissipation clarify the evolution of photoprotection mechanisms upon land colonization. Proc. Natl. Acad. Sci. USA 107: 11128–11133 - PMC - PubMed
    1. Allen J.F. (1992). Protein phosphorylation in regulation of photosynthesis. Biochim. Biophys. Acta 1098: 275–335 - PubMed
    1. Aro E.M., Ohad I. (2003). Redox regulation of thylakoid protein phosphorylation. Antioxid. Redox Signal. 5: 55–67 - PubMed
    1. Aro E.M., Virgin I., Andersson B. (1993). Photoinhibition of photosystem II. Inactivation, protein damage and turnover. Biochim. Biophys. Acta 1143: 113–134 - PubMed
    1. Bailleul B., Cardol P., Breyton C., Finazzi G. (2010a). Electrochromism: A useful probe to study algal photosynthesis. Photosynth. Res. 106: 179–189 - PubMed

MeSH terms

Substances

Associated data

LinkOut - more resources