. 2013 Jun;12(3):370-80.
doi: 10.1111/acel.12057. Epub 2013 Mar 24.

mTOR regulates tau phosphorylation and degradation: implications for Alzheimer's disease and other tauopathies

Affiliations

mTOR regulates tau phosphorylation and degradation: implications for Alzheimer's disease and other tauopathies

Antonella Caccamo et al. Aging Cell. 2013 Jun.

Abstract

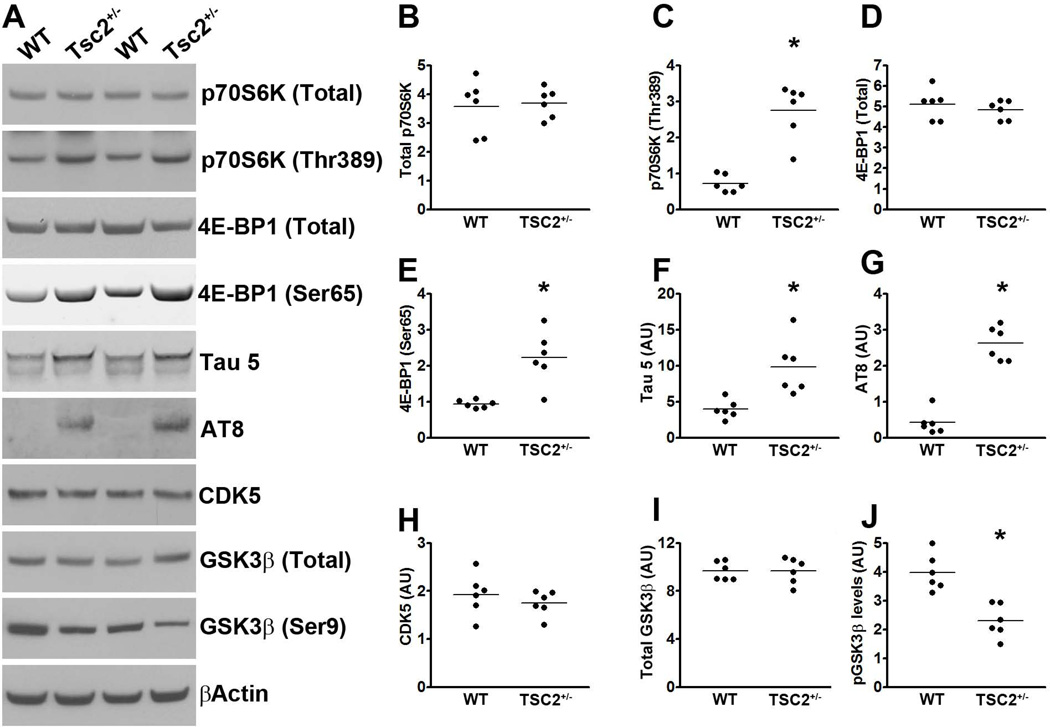
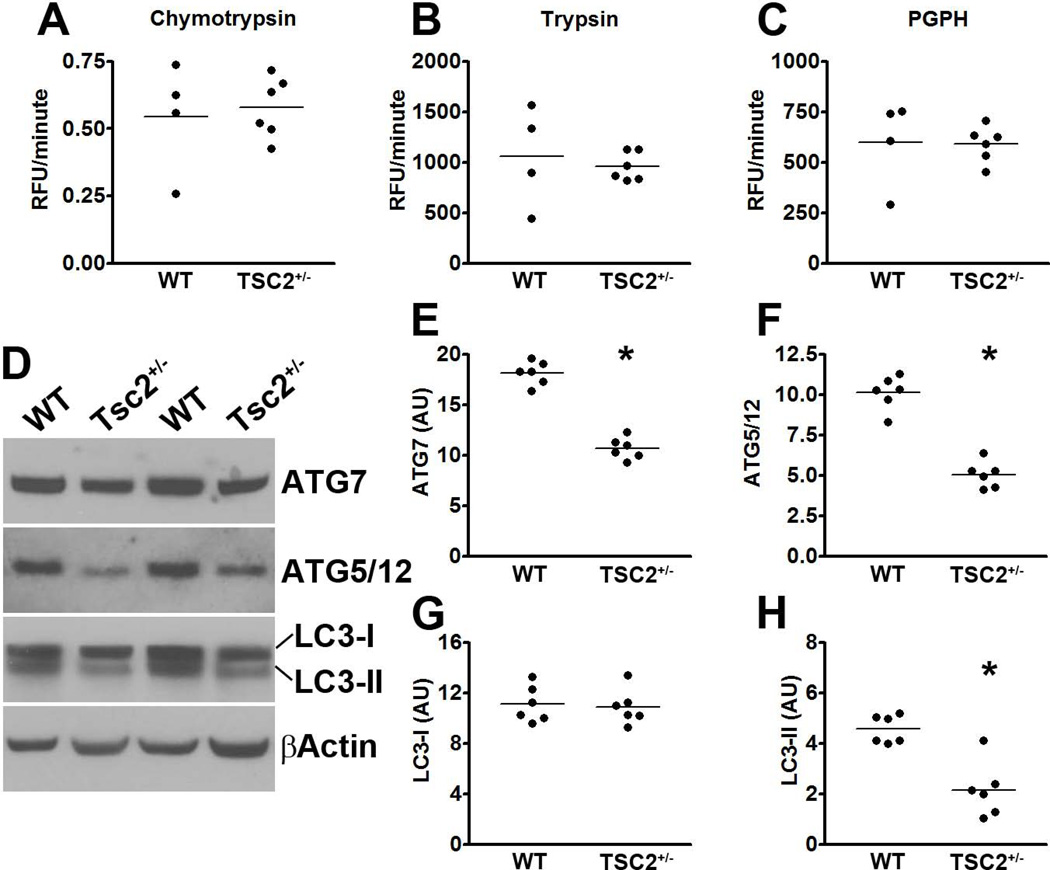
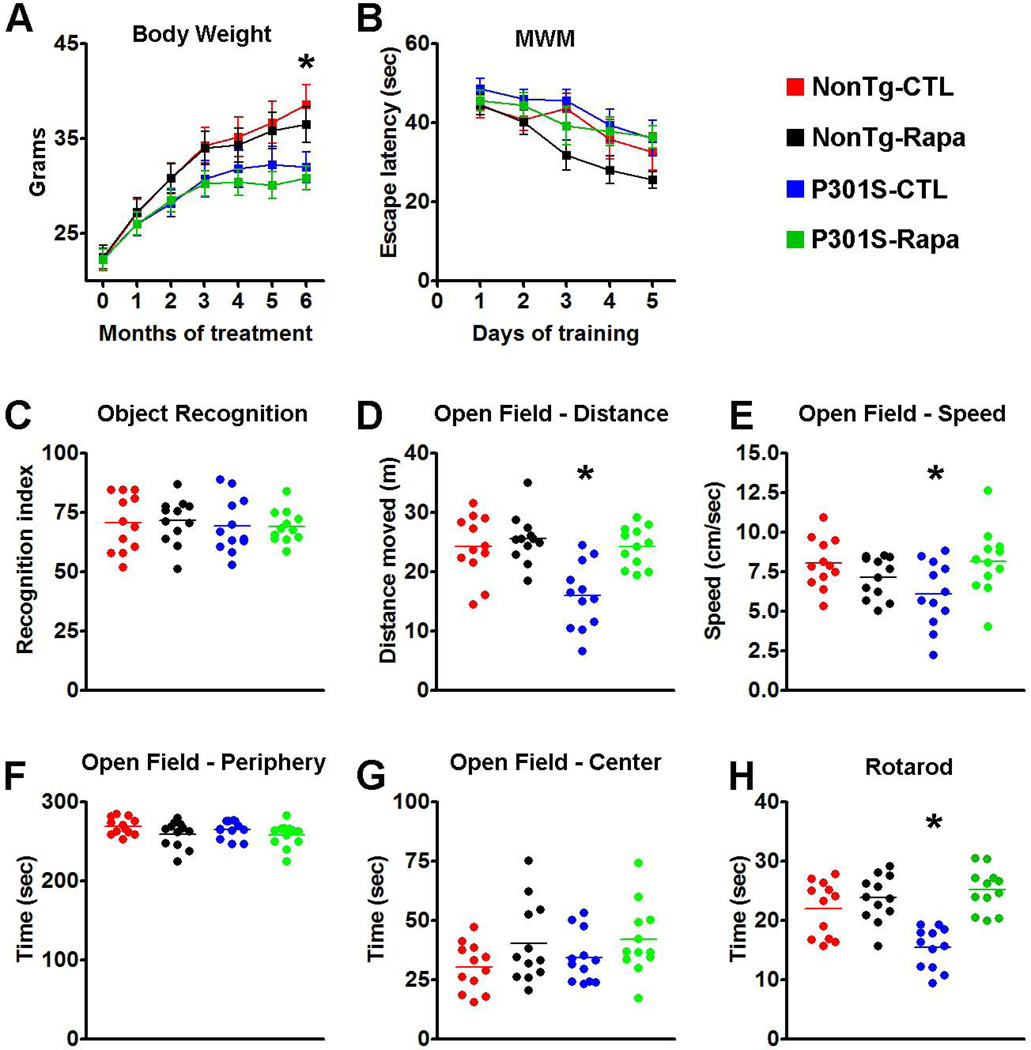
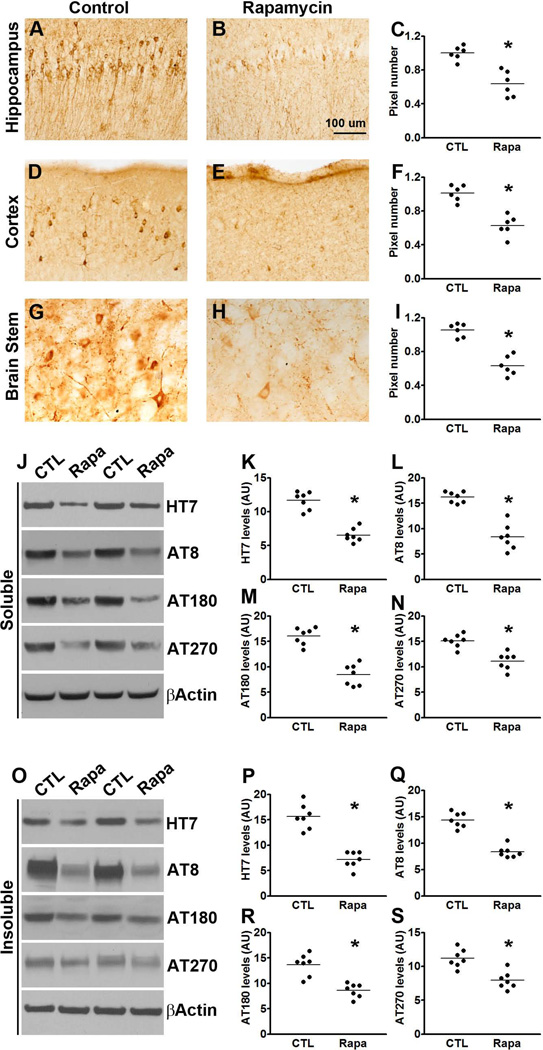
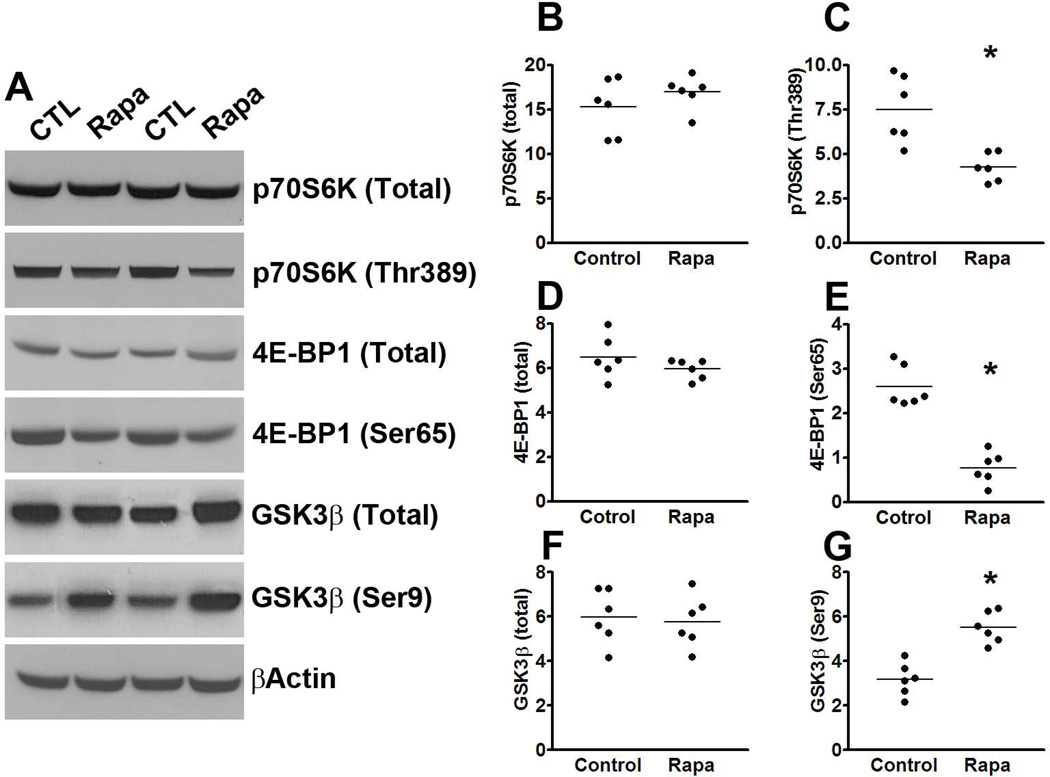
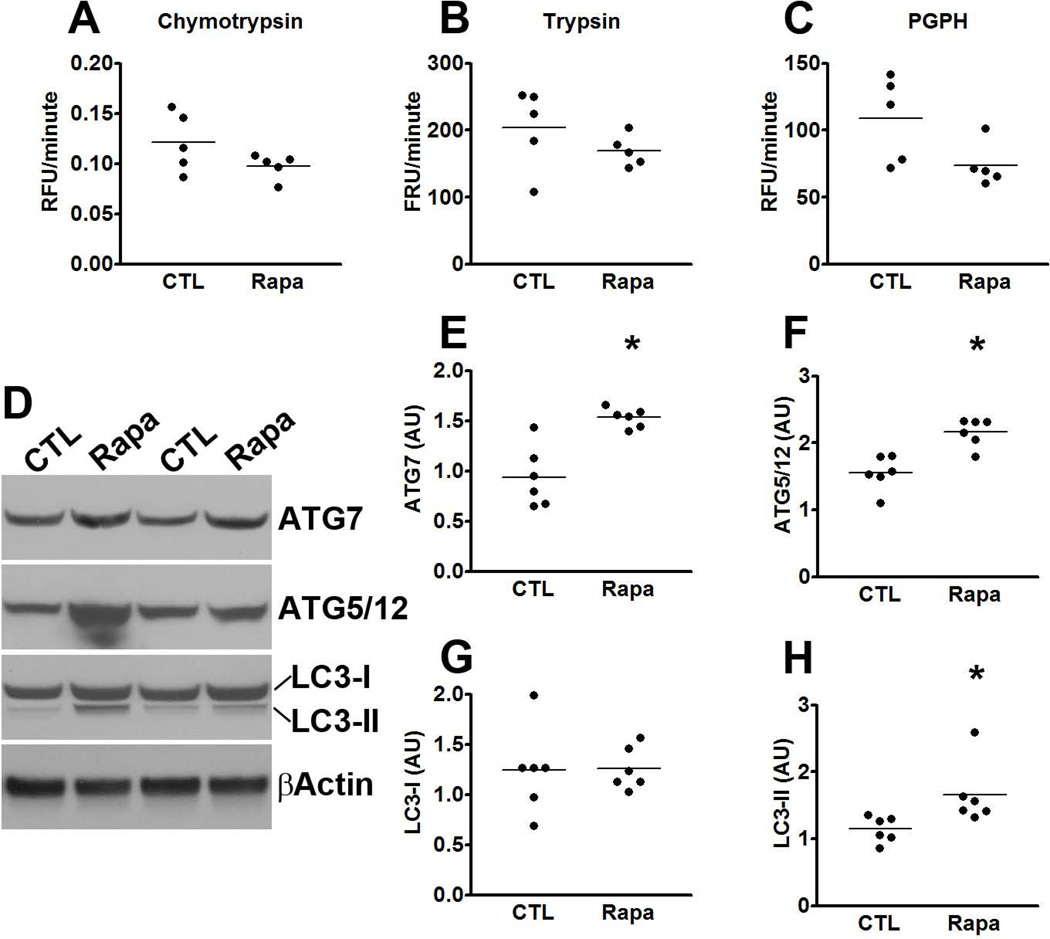
Accumulation of tau is a critical event in several neurodegenerative disorders, collectively known as tauopathies, which include Alzheimer's disease and frontotemporal dementia. Pathological tau is hyperphosphorylated and aggregates to form neurofibrillary tangles. The molecular mechanisms leading to tau accumulation remain unclear and more needs to be done to elucidate them. Age is a major risk factor for all tauopathies, suggesting that molecular changes contributing to the aging process may facilitate tau accumulation and represent common mechanisms across different tauopathies. Here, we use multiple animal models and complementary genetic and pharmacological approaches to show that the mammalian target of rapamycin (mTOR) regulates tau phosphorylation and degradation. Specifically, we show that genetically increasing mTOR activity elevates endogenous mouse tau levels and phosphorylation. Complementary to it, we further demonstrate that pharmacologically reducing mTOR signaling with rapamycin ameliorates tau pathology and the associated behavioral deficits in a mouse model overexpressing mutant human tau. Mechanistically, we provide compelling evidence that the association between mTOR and tau is linked to GSK3β and autophagy function. In summary, we show that increasing mTOR signaling facilitates tau pathology, while reducing mTOR signaling ameliorates tau pathology. Given the overwhelming evidence that reducing mTOR signaling increases lifespan and healthspan, the data presented here have profound clinical implications for aging and tauopathies and provide the molecular basis for how aging may contribute to tau pathology. Additionally, these results provide preclinical data indicating that reducing mTOR signaling may be a valid therapeutic approach for tauopathies.


Figures

Figure 1
Figure 1. mTOR signaling inversely correlates with Tau levels and phosphorylation in TSC2+/− mice
(A) Western blots of proteins extracted from the hippocampi of TSC2+/− mice and WT littermates, and probed with the indicated antibodies. (B-C) Quantitative analyses of total and phosphorylated p70S6K, respectively. Statistical analyses show that the levels of p70S6K phosphorylated at Thr389 were significantly higher in the hippocampi of the TSC2+/− mice compared to WT littermates. (D-E) Quantitative analyses of total and phosphorylated 4E-BP1, respectively, showed that the levels of 4E-BP1 phosphorylated at Ser65 were significantly higher in the hippocampi of the TSC2+/− mice compared to WT littermates. (F-G) Quantitative analyses of total (detected by the tau 5 antibody) and phosphorylated (detected by the AT8 antibody) tau showed that endogenous mouse levels were significantly higher in the hippocampi of the TSC2+/− mice compared to WT littermates. (H) Quantitative analyses of the CDK5 band showed no differences between the two groups of mice. (I-J) Quantitative analyses of the total and phospho-GSK3β bands, respectively. Statistical analyses indicated no changes in total GSK3β levels between the two groups. In contrast, the levels of GSK3β phosphorylated at Ser9 were significantly lower in the hippocampi of the TSC2+/− mice. Quantifications of the Western blots were done by normalizing the protein of interest to β-actin, which was used as a loading control. Data are presented as means ± SEM and analyzed by student’s t-test.
Figure 2
Figure 2. Autophagy induction is decreased in the brains of TSC2+/− mice
(A-C) Hippocampi homogenates from TSC2+/− and WT littermates were analyzed for proteasome activity. The data show that removing one TSC2 allele did not alter the chymotrypsin- and trypsin- like activities, nor did it change the peptidylglutamyl-peptide hydrolyzing (PDPH) activity. (D) Western blots of proteins extracted from the hippocampi of TSC2+/− mice and WT littermates. (E-H) Quantitative analyses of the blots show that the levels of the autophagy related proteins Atg7 (E) and Atg5/12 (F) were significantly decreased in TSC2+/− mice. Further, while quantitative analyses of the LC3-I levels showed no differences between the two groups of mice (G), LC3-II levels were significantly lower in the hippocampi of TSC2+/− mice compared to WT littermates (H). Quantifications of the Western blots were done by normalizing the protein of interest to β-actin, which was used as a loading control. Data are presented as means ± SEM and analyzed by student’s t-test.
Figure 3
Figure 3. Rapamycin improves motor deficits in P301S mice
(A) Transgenic P301S and NonTg mice were treated with rapamycin for 6 months. The graph shows the average body weight for each group of mice, measured monthly. Notably, the body weight of the P301S mice starts to plateau after 4 months of treatment while the WT mice gain weight throughout the treatment period. Statistical analyses indicated that this difference was linked to the genotype and was independent of rapamycin administration. (B) Learning curve depicting mice performance in the Morris water maze. All mice significantly learned the task over the 5 days of training, as indicated by a reduced time to find the escape platform; however, no statistically significant changes were detected among the groups. (C) Novel object recognition tests, a behavioral task highly dependent on the cortex, shows no differences among the 4 groups of mice. The graph depicts the recognition index, i.e., the percentage of exploration time that mice spend exploring the new object. (D-G) Open field activity measures spontaneous activity and anxiety. The data show that during the test, the P301S mice moved less (D) and at a slower speed (E) compared to the other three groups of mice. These changes were statistically significant. In contrast, no differences among the groups were found when measuring the time spent in the periphery and center of the arena (F and G, respectively), indicating that the P301S mice had no detectable anxiety defects and that rapamycin did not alter this normal condition. (H) The graph shows data obtained with the accelerating rotarod. Statistical evaluation indicated that the P301S-CTL mice were significantly impaired in this task and that rapamycin administration rescued this motor deficit. Indeed, the P301S-Rapa mice performed as well as the two NonTg groups. Data are presented as means ± SEM and were analyzed by two-way ANOVA followed by a Bonferroni test to determine individual differences among groups.
Figure 4
Figure 4. Rapamycin decreases tau pathology in P301S mice
(A-I) Microphotographs and quantitative analyses of P301S mice treated with rapamycin or control diet and stained with the AT8 antibody. (J) Western blots of soluble tau extracted from the brains of P301S mice treated with rapamycin or control diet and probed with the indicated antibodies. (F-H) Quantitative analyses of the blots show that rapamycin treatment significantly decreased the levels of tau phosphorylated at the AT8, AT180 and AT270 epitopes. (O) Western blots of insoluble tau extracted from the brains of P301S mice treated with rapamycin or control diet and probed with the indicated antibodies. (P-S) Quantitative analyses of the blots show that rapamycin significantly decreased the levels of tau phosphorylated at the AT8, AT180 and AT270 epitopes. Quantifications of the Western blots were done by normalizing the protein of interest to β-actin, which was used as a loading control. Data are presented as means ± SEM and analyzed by student’s t-test.
Figure 5
Figure 5. mTOR signaling is decreased in P301S mice treated with rapamycin
(A) Western blots of proteins extracted from the brains of P301S mice treated with rapamycin or control diet and probed with the indicated antibodies. (B-E) Quantitative analyses of the blots show that the levels of p70S6K phosphorylated at Thr389 and 4E-BP1 phosphorylated at Ser65 were significantly lower in the rapamycin treated mice compared to the mice on control diet. (F-G) Quantitative analyses of the blots show that the levels of GSK3β were significantly lower in the rapamycin treated mice compared to the mice on control diet, while no difference was detected for total GSK3β levels. Quantifications of the Western blots were done by normalizing the protein of interest to β-actin, which was used as a loading control. Data are presented as means ± SEM and analyzed by student’s t-test.
Figure 6
Figure 6. Autophagy induction is increased in the brains of rapamycin-treated P301S mice
(A-C) Brain homogenates from rapamycin- and control-treated P301S mice were analyzed for proteasome activity. The data show that rapamycin did not alter the chymotrypsin- and trypsin- like activities, nor did it change the peptidylglutamyl-peptide hydrolyzing (PDPH) activity. (D) Representative Western blots of proteins extracted from the brains of P301S mice treated with rapamycin or control diet. (E-H) Quantitative analyses of the blots show that the levels of the autophagy related proteins Atg7 (E) and Atg5/12 (F) were significantly increased in the P301S mice treated with rapamycin. While quantitative analyses of the LC3-I levels showed no differences between the two groups of mice (G), LC3-II levels were significantly higher in the rapamycin-treated P301S mice (H). Quantifications of the Western blots were done by normalizing the protein of interest to β-actin, which was used as a loading control. Data are presented as means ± SEM and analyzed by student’s t-test.

References

    1. An WL, Cowburn RF, Li L, Braak H, Alafuzoff I, Iqbal K, Iqbal IG, Winblad B, Pei JJ. Up-regulation of phosphorylated/activated p70 S6 kinase and its relationship to neurofibrillary pathology in Alzheimer's disease. The American journal of pathology. 2003;163:591–607. - PMC - PubMed
    1. Ballatore C, Lee VM, Trojanowski JQ. Tau-mediated neurodegeneration in Alzheimer's disease and related disorders. Nature reviews. 2007;8:663–672. - PubMed
    1. Bertram L, Tanzi RE. The genetics of Alzheimer's disease. Prog Mol Biol Transl Sci. 2012;107:79–100. - PubMed
    1. Caccamo A, Magri A, Oddo S. Age-dependent changes in TDP-43 levels in a mouse model of Alzheimer disease are linked to Abeta oligomers accumulation. Molecular neurodegeneration. 2010a;5:51. - PMC - PubMed
    1. Caccamo A, Majumder S, Oddo S. Cognitive decline typical of frontotemporal lobar degeneration in transgenic mice expressing the 25-kDa C-terminal fragment of TDP-43. The American journal of pathology. 2012;180:293–302. - PMC - PubMed

Publication types

MeSH terms

LinkOut - more resources