. 2014 Jul;24(7):1894-905.
doi: 10.1093/cercor/bht040. Epub 2013 Feb 20.

Largely typical patterns of resting-state functional connectivity in high-functioning adults with autism

Affiliations

Largely typical patterns of resting-state functional connectivity in high-functioning adults with autism

J Michael Tyszka et al. Cereb Cortex. 2014 Jul.

Abstract

A leading hypothesis for the neural basis of autism postulates globally abnormal brain connectivity, yet the majority of studies report effects that are either very weak, inconsistent across studies, or explain results incompletely. Here we apply multiple analytical approaches to resting-state BOLD-fMRI data at the whole-brain level. Neurotypical and high-functioning adults with autism displayed very similar patterns and strengths of resting-state connectivity. We found only limited evidence in autism for abnormal resting-state connectivity at the regional level and no evidence for altered connectivity at the whole-brain level. Regional abnormalities in functional connectivity in autism spectrum disorder were primarily in the frontal and temporal cortices. Within these regions, functional connectivity with other brain regions was almost exclusively lower in the autism group. Further examination showed that even small amounts of head motion during scanning have large effects on functional connectivity measures and must be controlled carefully. Consequently, we suggest caution in the interpretation of apparent positive findings until all possible confounding effects can be ruled out. Additionally, we do not rule out the possibility that abnormal connectivity in autism is evident at the microstructural synaptic level, which may not be reflected sensitively in hemodynamic changes measured with BOLD-fMRI.

Keywords: autism spectrum disorder; functional magnetic resonance imaging; independent component analysis; resting-state networks; temporal correlation.


Figures

Figure 1.
Figure 1.
Atlas-based temporal coherence analysis. Interregional correlation matrices (Fisher z-transformed) for (a) controls (n = 20) and (b) autism subjects (n = 19). The correlation matrix can be divided into conventional connection families as shown in (c). Both group matrices show essentially identical patterns of correlation, reflected in the low residuals of the difference matrix. Strong homotopic correlations are evident in both cortical and subcortical sub-matrices. No individual pair-wise comparisons survived FDR control (q = 0.05). Note that these matrices are upper triangle symmetric. (a and b) are shown with identical scale limits. The row ordering within each hemisphere for the correlation matrices follows the surface-lobe hierarchy of the Harvard-Oxford atlas. Non-gray matter regions (white matter, CSF) and the brain stem are excluded from the subcortical regions.
Figure 2.
Figure 2.
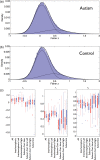
Two-component Gaussian mixture modeling example for all correlation matrix elements in (a) the control and (b) autism groups. (c) Comparison of mixture model means (μ0, μ1) and proportion (p0) between autism (red) and controls (blue). No group differences survived FDR control (q = 0.05).
Figure 3.
Figure 3.
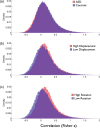
Normalized histograms of all correlations for (a) autism (red) versus controls (blue), (b) high (red) versus low (blue) translational motion groups and (c) high (red) and low (blue) angular motion groups. An equal number of autism and control subjects were included in each of the motion groups.
Figure 4.
Figure 4.
Scatterplot of homotopic z-transformed correlations for control and autism groups across all 48 regions. No significant between-group differences were observed following correction for multiple comparisons. Crosses indicate standard errors of the means for each group (control horizontal, autism vertical).
Figure 5.
Figure 5.
Thresholded t-map of regions that have significantly different pair-wise correlation between autism and control groups. The threshold is P < 0.05 with green indicating controls > autism and blue indicating autism > controls. The graph at right shows the total count of significantly positive group differences (control > autism) in each row of the correlation matrix. A region is identified as abnormal if the number of significantly different pair-wise correlations exceeds a Bonferroni-corrected threshold of 14 (P < 0.05/110 = 0.00045) with chance being 6. No significant counts of negative differences (autism > control) in each row were observed.
Figure 6.
Figure 6.
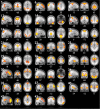
Spatial modes of the grand ICA over all subjects rank ordered by explained variance. Only neuronal ICs are shown for clarity. Tentative assignments for each spatial mode are listed in Table 2. MNI slice coordinates in mm are indicated below each image; sagittal slices with negative coordinates are within the left hemisphere.
Figure 7.
Figure 7.
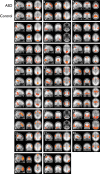
Group mean spatial maps for dual-regression of the 23 grand ICs to individual subjects demonstrating the between-group similarities. No meaningful between-group differences were observed for any grand IC. Slice locations for each IC are identical to those in Figure 6.

References

    1. Abell F, Krams M, Ashburner J, Passingham R, Friston K, Frackowiak R, Happe F, Frith C, Frith U. The neuroanatomy of autism: a voxel-based whole brain analysis of structural scans. Neuroreport. 1999;10:1647–1651. - PubMed
    1. Andersson JL, Smith S, Jenkinson M. FNIRT–FMRIB non-linear image registration tool. 14th Annual Meeting of the Organization for Human Brain Mapping; Melbourne, Australia. 2008. p. 496.
    1. Anderson JS, Druzgal TJ, Froehlich A, Dubray MB, Lange N, Alexander AL, Abildskov T, Nielsen JA, Cariello AN, Cooperrider JR, et al. Decreased interhemispheric functional connectivity in autism. Cereb Cortex. 2011;21:1134–1146. - PMC - PubMed
    1. Anderson JS, Nielsen JA, Froehlich AL, DuBray MB, Druzgal TJ, Cariello AN, Cooperrider JR, Zielinski BA, Ravichandran C, Fletcher PT, et al. Functional connectivity magnetic resonance imaging classification of autism. Brain. 2011;134:3742–3754. - PMC - PubMed
    1. Andersen LM, Naswall K, Manouilenko I, Nylander L, Edgar J, Ritvo RA, Ritvo E, Bejerot S. The Swedish version of the Ritvo autism and asperger diagnostic scale: revised (RAADS-R). A validation study of a rating scale for adults. J Autism Dev Disord. 2011;41:1635–1645. - PMC - PubMed

Publication types