Comparative Study
. 2013:3:1313.
doi: 10.1038/srep01313.

Monochromatic computed tomography with a compact laser-driven X-ray source

Affiliations
Comparative Study

Monochromatic computed tomography with a compact laser-driven X-ray source

K Achterhold et al. Sci Rep. 2013.

Abstract

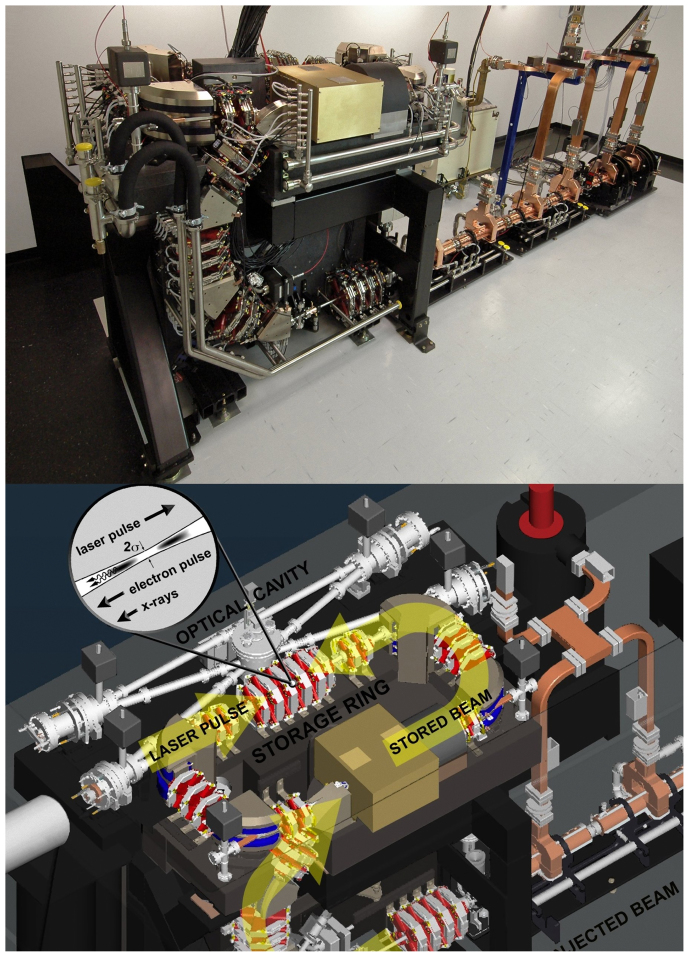
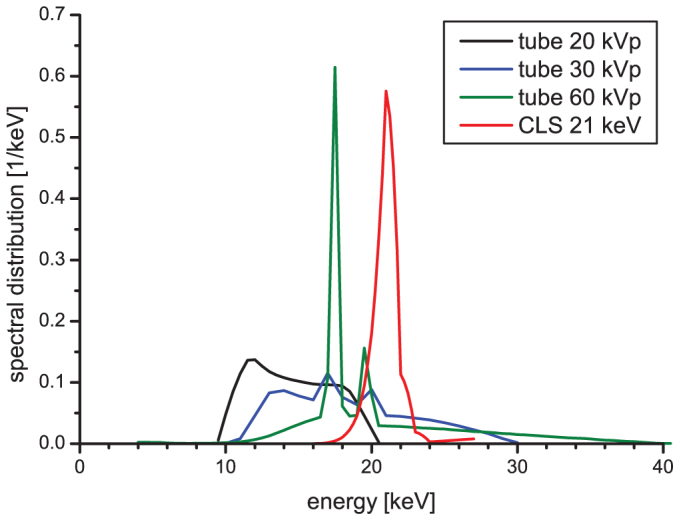
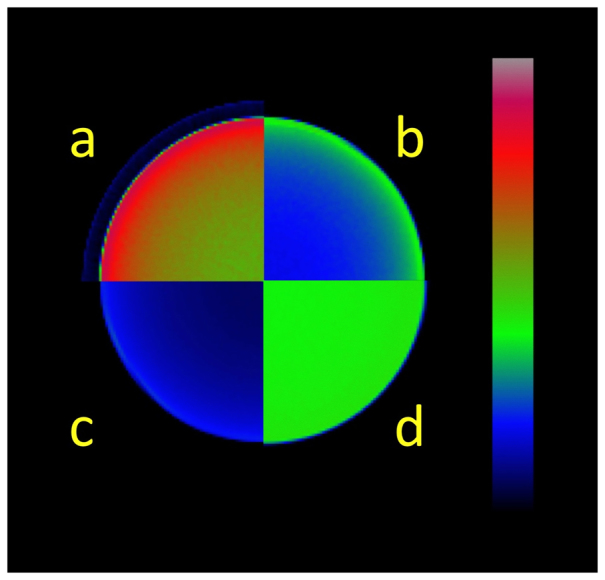
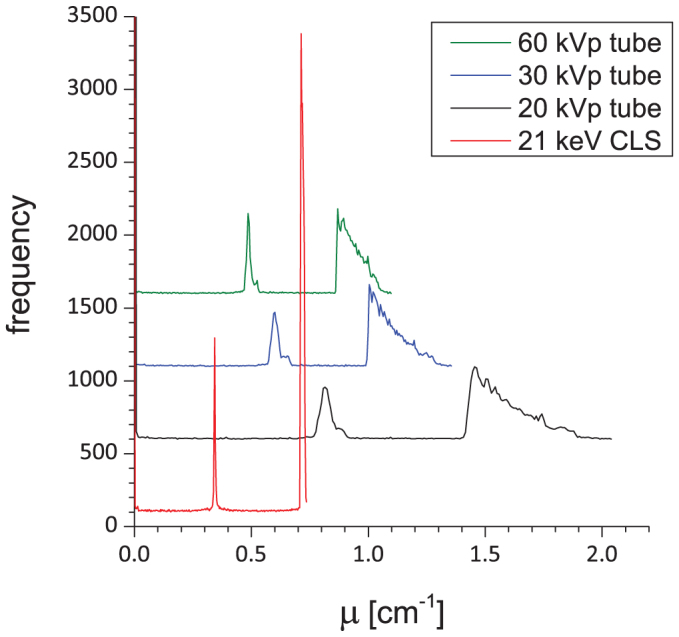
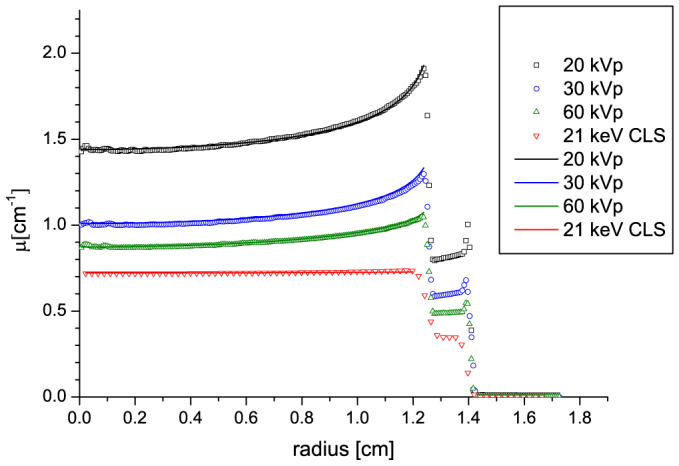
A laser-driven electron-storage ring can produce nearly monochromatic, tunable X-rays in the keV energy regime by inverse Compton scattering. The small footprint, relative low cost and excellent beam quality provide the prospect for valuable preclinical use in radiography and tomography. The monochromaticity of the beam prevents beam hardening effects that are a serious problem in quantitative determination of absorption coefficients. These values are important e.g. for osteoporosis risk assessment. Here, we report quantitative computed tomography (CT) measurements using a laser-driven compact electron-storage ring X-ray source. The experimental results obtained for quantitative CT measurements on mass absorption coefficients in a phantom sample are compared to results from a rotating anode X-ray tube generator at various peak voltages. The findings confirm that a laser-driven electron-storage ring X-ray source can indeed yield much higher CT image quality, particularly if quantitative aspects of computed tomographic imaging are considered.


Conflict of interest statement

The authors declare no competing financial interests. Professor Ronald Ruth's contributions to this publication were as a paid consultant of Lyncean Technologies Inc., and were not part of his Stanford University duties or responsibilities.

Figures

Figure 1
Figure 1. Overview of the Compact Light Source (CLS).
Upper image: front view of the CLS showing the injector (on the right), the transport line (on the left) and the electron storage ring (at the top). The length of the CLS is about 5 m. Lower image: CAD drawing of the CLS with the electron storage ring and the optical cavity of the infrared laser system. The interaction point of the laser pulse and the electron pulse is emphasized.
Figure 2
Figure 2. X-ray spectra for the experiment.
Black, blue and green lines: Spectra of the FR591 rotating anode X-ray tube at peak voltages of 20, 30 and 60 kVp calculated from the measured values of the linear absorption coefficient μ of the water phantom with an expectation maximization algorithm according to Sidky et al.. Red line: Spectrum of the Compact Light Source at 21 keV calculated from the measured values of the linear absorption coefficient μ of the water phantom. For a measured spectrum of the CLS at 21 keV see Supplementary Fig. S1 online.
Figure 3
Figure 3. Tomographic reconstruction of the water sample in a polypropylen container.
(a), (b), (c): measured with the FR591 rotating anode X-ray tube working at 20, 30 and 60 kVp, respectively. (d): measured with the compact light source at 21 keV. Color scales represent measured density times absorption coefficients (ρ · μ) at the used X-ray energy. The polypropylene container is barely seen in (a).
Figure 4
Figure 4. Histograms of the tomographic images of Fig. 3.
From top to bottom green, blue and black lines represent the frequency of absorption coefficients μ for the measurement with the X-ray tube at 60, 30 and 20 kVp. Red line gives the values for the measurement with the CLS at 21 keV. Histograms are shifted along the frequency axis, respectively, for clarity.
Figure 5
Figure 5. Radial profile plots.
Symbols: radial profile plot of the tomographic data as shown in Fig. 3 from the center of the cylindrical sample to the surrounding air. From top to bottom at 20, 30 and 60 kVp measured with the FR591 X-ray tube and for 21 keV with the compact light source. Lines: linear absorption coefficients calculated with the corresponding spectra given in Fig. 2.
Figure 6
Figure 6. Absorption computer tomography of a mouse.
(a),(b) Two tomographic views of the upper body of a mouse. (c),(d) Details of the head region. For 3D datasets see the Supplementary video files S2 and S3 online.

References

    1. Coolidge W. D. A powerfull Röntgen ray tube with a pure electron discharge. The Physical Review II, 409–430 (1913).
    1. Hubbell J. H. Photon mass attenuation and energy-absorption coefficients. The International Journal of Applied Radiation and Isotopes 33, 1269–1290 (1982).
    1. Brooks R. A. & Di Chiro G. Beam hardening in x-ray reconstructive tomography. Physics in medicine and biology 21, 390–8 (1976). - PubMed
    1. Augat P., Fuerst T. & Genant H. K. Quantitative Bone Mineral Assessment at the Forearm : A Review. Osteoporos Int. 8, 299–310 (1998). - PubMed
    1. Huang Z. & Ruth R. Laser-Electron Storage Ring. Physical Review Letters 80, 976–979 (1998).

Publication types