

Update: Influenza activity - United States, September 30, 2012-February 9, 2013
- PMID: 23425961
- PMCID: PMC4604885
Item in Clipboard
Update: Influenza activity - United States, September 30, 2012-February 9, 2013
MMWR Morb Mortal Wkly Rep.
.
Abstract
Influenza activity in the United States began to increase in mid-November and remained elevated through February 9, 2013. During that time, influenza A (H3N2) viruses predominated overall, followed by influenza B viruses. This report summarizes U.S. influenza activity* since the beginning of the 2012-13 influenza season and updates the previous summary.
Figures
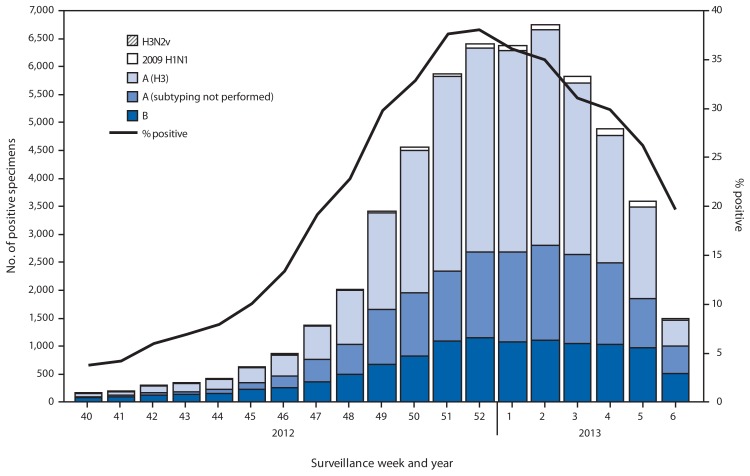
Number and percentage of respiratory specimens testing positive for influenza, by type, surveillance week, and year — U.S. World Health Organization and National Respiratory and Enteric Virus Surveillance System collaborating laboratories, United States, 2012–13 influenza season
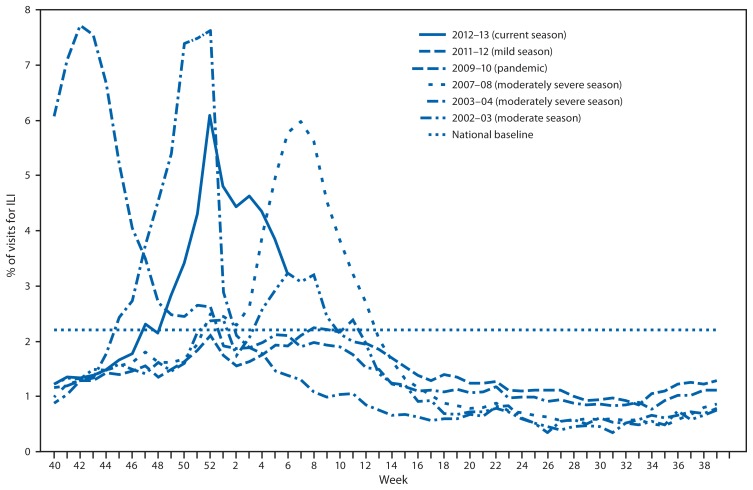
Percentage of visits for influenza-like illness (ILI) reported by the U.S. Outpatient Influenza-Like Illness Surveillance Network (ILINet), by surveillance week and year — United States, 2012–13 and selected previous influenza seasons* * Data as of February 16, 2013.
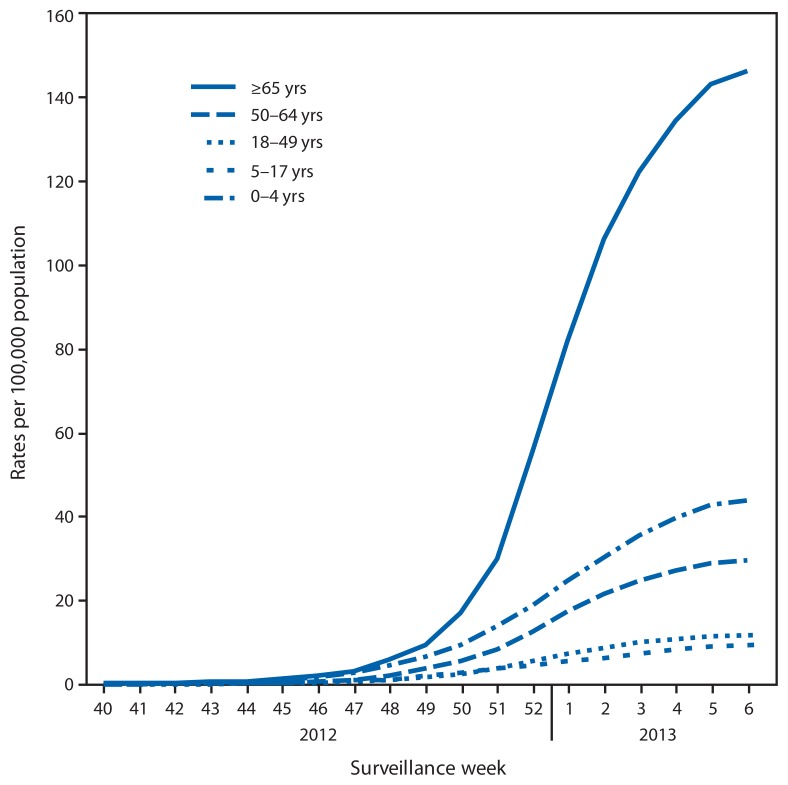
Rates of hospitalization for laboratory-confirmed influenza, by age group and surveillance week — FluSurv-NET,* 2012–13 influenza season† * FluSurv-NET conducts population-based surveillance for laboratory-confirmed influenza-associated hospitalizations in children aged <18 years (since the 2003–04 influenza season) and adults aged ≥18 years (since the 2005–06 influenza season). The FluSurv-NET covers approximately 80 counties in the 10 Emerging Infections Program states (California, Colorado, Connecticut, Georgia, Maryland, Minnesota, New Mexico, New York, Oregon, and Tennessee) and additional Influenza Hospitalization Surveillance Project states (Iowa, Michigan, Ohio, Rhode Island, and Utah). † Data as of February 16, 2013.
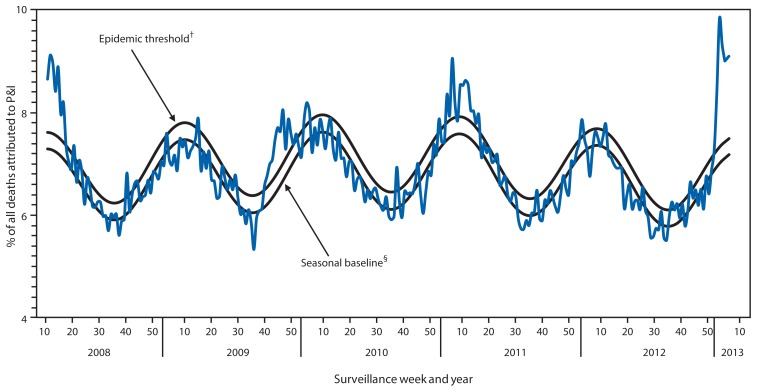
Percentage of all deaths attributable to pneumonia and influenza (P&I), by surveillance week and year — 122 U.S. Cities Mortality Reporting System, United States, 2008–2013* * For the reporting week ending February 9, 2013. † The epidemic threshold is 1.645 standard deviations above the seasonal baseline. § The seasonal baseline is projected using a robust regression procedure that applies a periodic regression model to the observed percentage of deaths from P&I during the preceding 5 years.
References
-
- CDC. Update: influenza activity—United States, September 30–November 24, 2012. MMWR. 2012;61:990–3. - PubMed
-
- CDC. Prevention and control of influenza with vaccines: recommendations of the Advisory Committee on Immunization Practices (ACIP) MMWR. 2010;59(RR-8) - PubMed
-
- Dao CN, Kamimoto L, Nowell M, et al. Adult hospitalizations for laboratory-positive influenza during the 2005–2006 through 2007–2008 seasons in the United States. J Infect Dis. 2010;202:881–8. - PubMed
-
- Thompson WW, Shay DK, Weintrab E, et al. Mortality associated with influenza and respiratory syncytial virus in the United States. JAMA. 2003;289:179–86. - PubMed
MeSH terms
Substances
LinkOut - more resources
Full Text Sources
Medical
