. 2013 Mar;123(3):1019-31.
doi: 10.1172/JCI64931. Epub 2013 Feb 15.

IL-6 trans-signaling promotes pancreatitis-associated lung injury and lethality

Affiliations

IL-6 trans-signaling promotes pancreatitis-associated lung injury and lethality

Hong Zhang et al. J Clin Invest. 2013 Mar.

Abstract

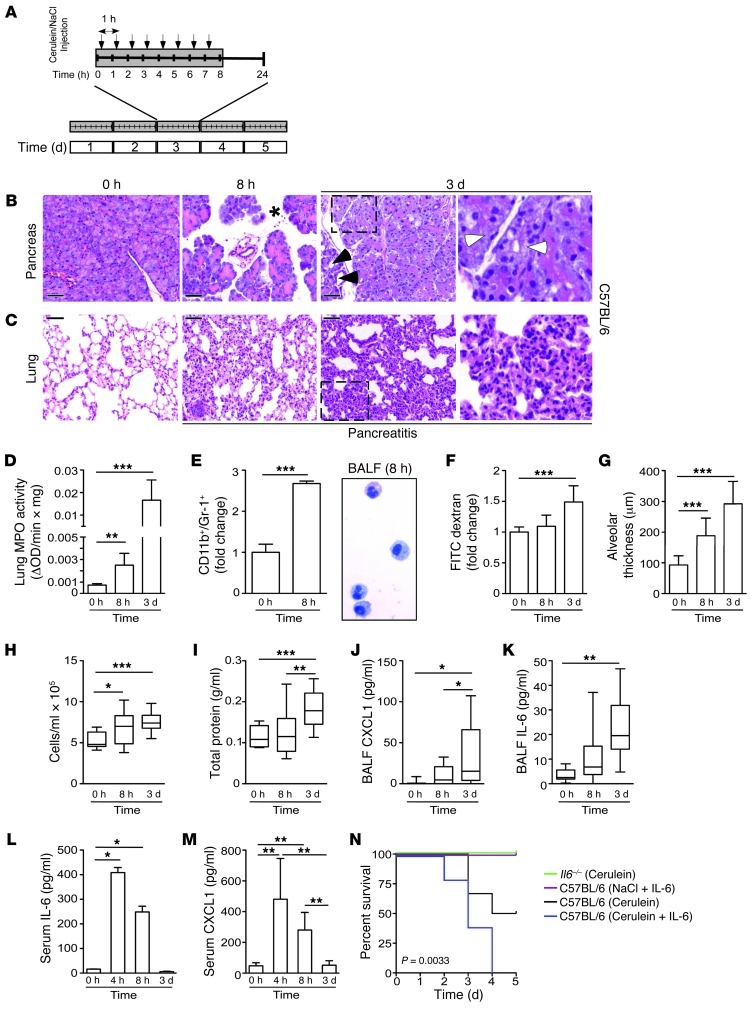
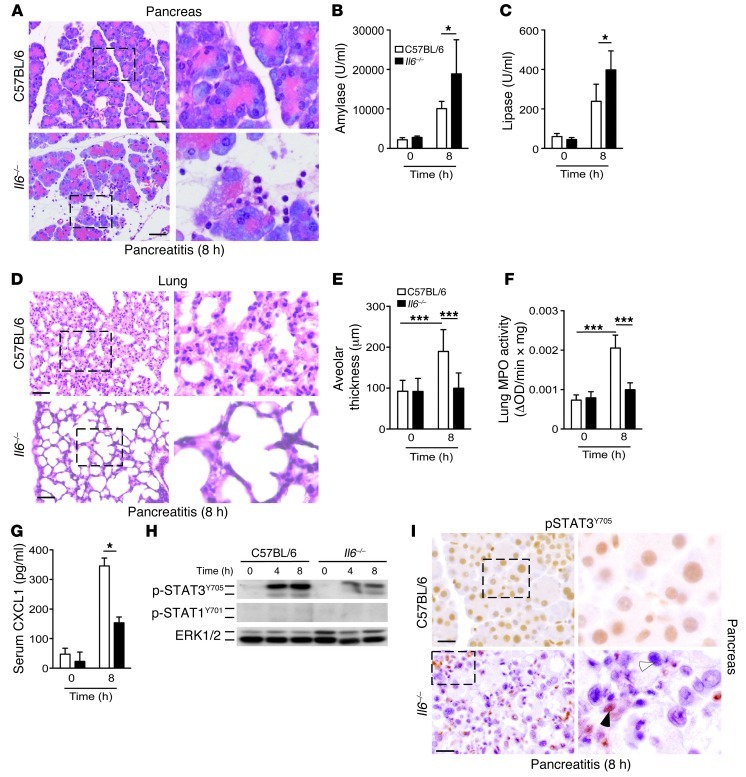
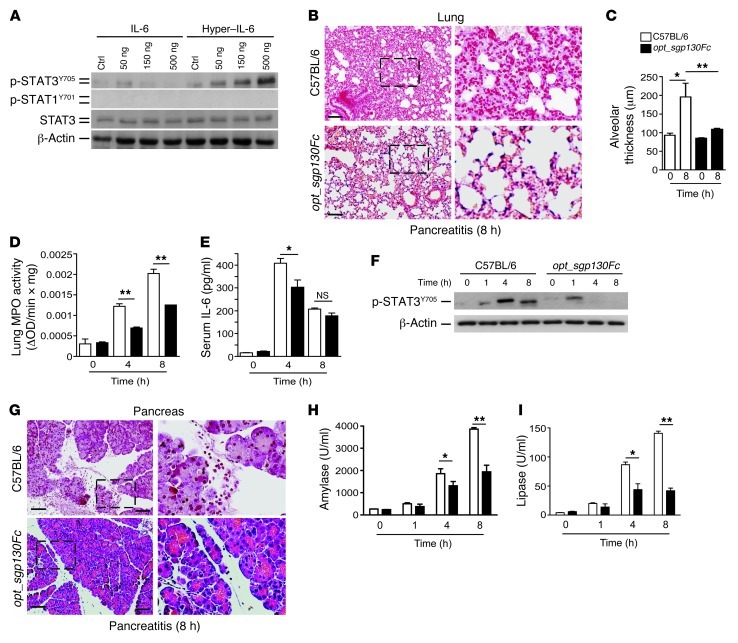
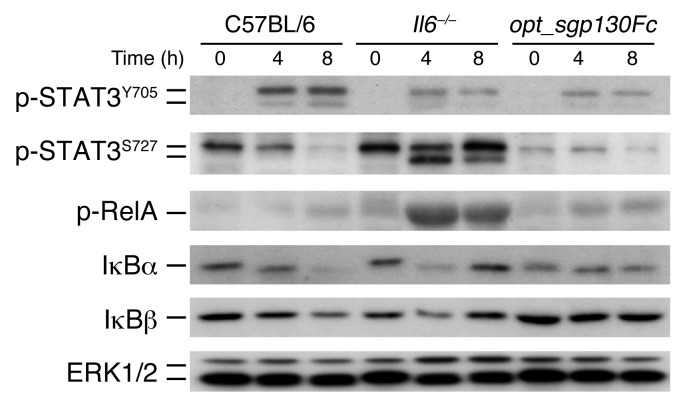
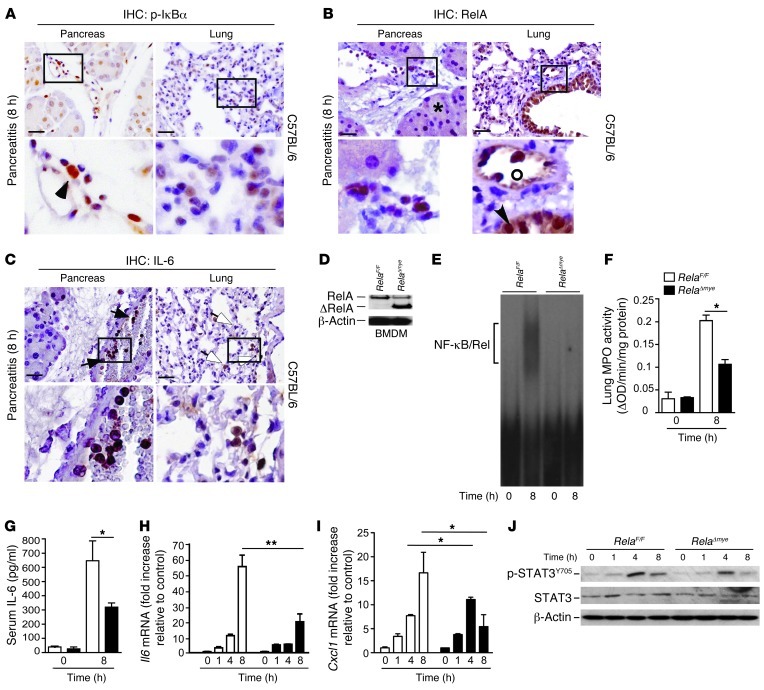
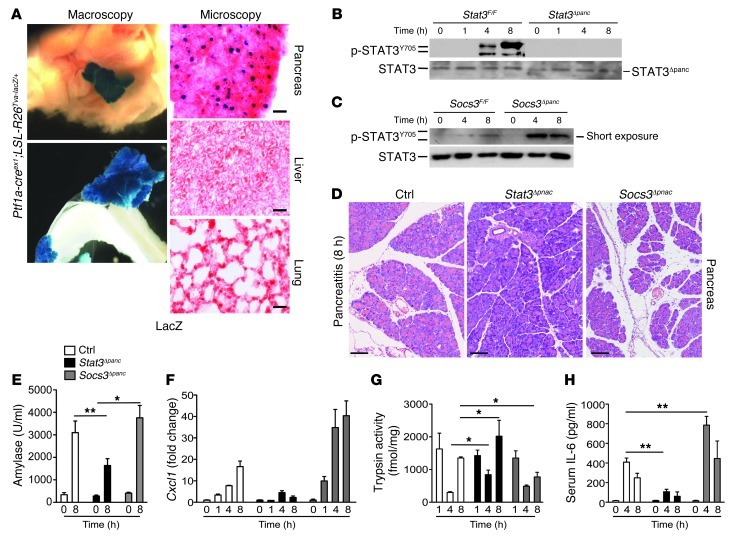
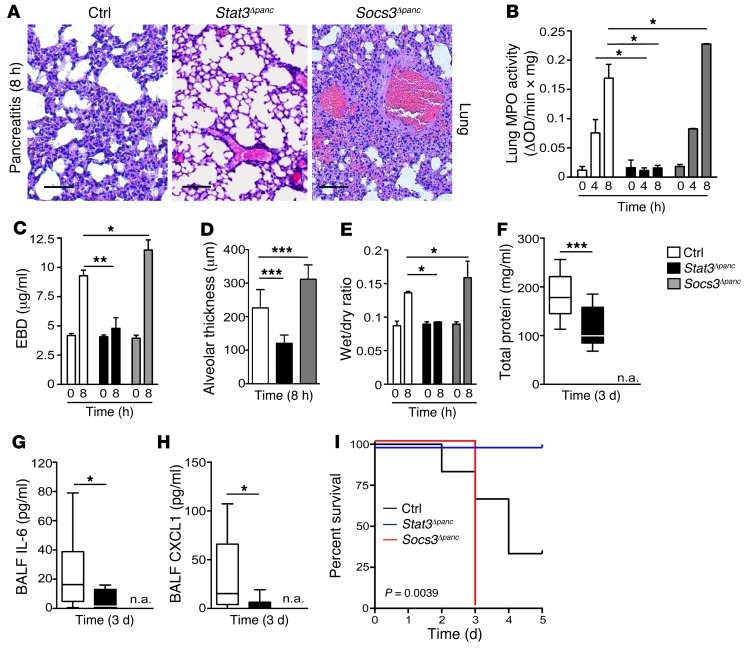
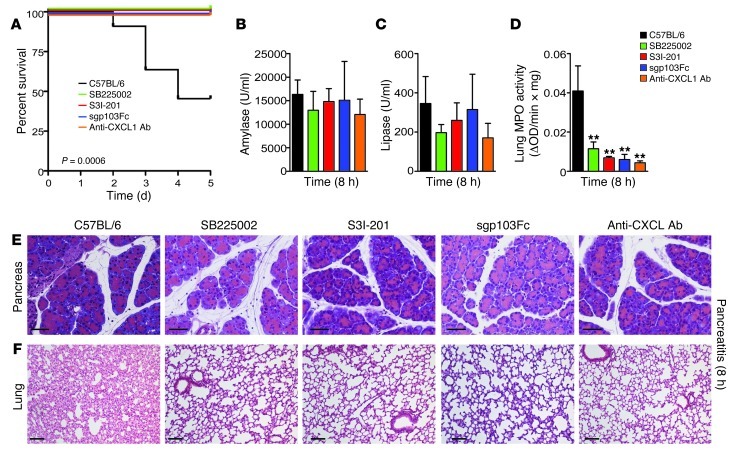
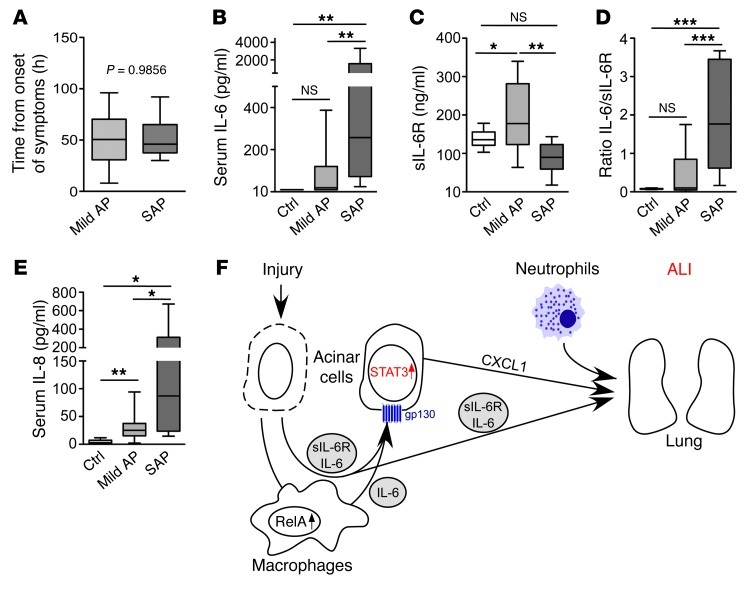
Acute lung injury (ALI) is an inflammatory disease with a high mortality rate. Although typically seen in individuals with sepsis, ALI is also a major complication in severe acute pancreatitis (SAP). The pathophysiology of SAP-associated ALI is poorly understood, but elevated serum levels of IL-6 is a reliable marker for disease severity. Here, we used a mouse model of acute pancreatitis-associated (AP-associated) ALI to determine the role of IL-6 in ALI lethality. Il6-deficient mice had a lower death rate compared with wild-type mice with AP, while mice injected with IL-6 were more likely to develop lethal ALI. We found that inflammation-associated NF-κB induced myeloid cell secretion of IL-6, and the effects of secreted IL-6 were mediated by complexation with soluble IL-6 receptor, a process known as trans-signaling. IL-6 trans-signaling stimulated phosphorylation of STAT3 and production of the neutrophil attractant CXCL1 in pancreatic acinar cells. Examination of human samples revealed expression of IL-6 in combination with soluble IL-6 receptor was a reliable predictor of ALI in SAP. These results demonstrate that IL-6 trans-signaling is an essential mediator of ALI in SAP across species and suggest that therapeutic inhibition of IL-6 may prevent SAP-associated ALI.


Figures

Figure 1
Figure 1. IL-6 levels correlate with the extent of pulmonary damage and lethality during SAP.
(A) Schematic model for SAP. (B and C) Histological sections of H&E-stained pancreatic and lung tissue of C57BL/6 mice at the indicated time points. Note the increase of edema (asterisk) and necrosis (white arrowheads) in the pancreas after 8 hours and 3 days and the first signs of regeneration of damaged pancreatic tissue (black arrowheads) after 3 days. Lung damage continued to increase after 3 days, as demonstrated by alveolar wall thickening and collapse (see higher-magnification views of boxed regions at far right; enlarged ×3). (D) MPO activity in lung tissue of C57BL/6 mice (n = 5). (E) Flow cytometry analysis of CD11b+/Gr-1+ cells in total lung tissue (n = 6) and cytospin preparation of BALF in C57BL/6 mice. (F) Lung permeability, evaluated by FITC-dextran clearance. (G) Interstitial fluid accumulation, measured as capillary-alveolar membrane thickness (n = 10). (HK) Total cell count (H), total protein concentration (I), BALF CXCL1 (J), and BALF IL-6 (K) (n = 1–3 per condition; 4 independent experiments). (L and M) Serum levels of IL-6 (L) and CXCL1 (M) in C57BL/6 mice (n > 5). (N) Kaplan-Meier curves of cerulein-treated Il6–/– mice (green; n = 5) and of C57BL/6 mice treated with cerulein (black; n = 6), cerulein plus 5 μg/d recombinant IL-6 (blue; n = 5), or NaCl sham plus 5 μg/d recombinant IL-6 (purple; n = 5). Results represent mean ± SD. *P < 0.05, **P < 0.005, ***P < 0.001. Scale bars: 50 μm.
Figure 2
Figure 2. IL-6 is required to link pancreatic damage to pulmonary damage during AP.
C57BL/6 and Il6–/– mice were subjected to 8 hours of AP. (A) Morphological analysis of H&E-stained pancreatic tissue. (B and C) Amylase and lipase levels (n = 4). (D) Histological sections of lung tissue. Note the increased alveolar wall thickening and collapse in C57BL/6 mice. (E) Capillary-alveolar membrane thickness (n = 10). (F) MPO activity in lung tissue (n > 5). (G) Serum CXCL1 (n = 4). (H) Pancreatic tissue was isolated at the indicated time points and homogenized to detect p-STAT3Y705 and p-STAT1Y701. ERK1/2 served as loading control (representative blot; n = 4 per time point). (I) IHC staining of p-STAT3Y705 in pancreatic tissue. Only C57BL/6 mice showed STAT3 activation in acinar cells; Il6–/– mice showed phosphorylation of STAT3 in immune cells (black arrowhead), but not in acinar cells (white arrowhead). Results represent mean ± SD. *P < 0.05, ***P < 0.001. Scale bars: 50 μm. Boxed regions are shown at higher magnification at right (enlarged ×3).
Figure 3
Figure 3. IL-6 trans-signaling via STAT3 mediates ALI during SAP.
(A) Acinar cells were incubated with indicated concentrations of IL-6 or hyper–IL-6 for 2 hours. Protein lysates from incubated acinar cells were homogenized and blotted with p-STAT3Y705, p-STAT1Y701, and STAT3. β-Actin served as loading control (representative blot; n = 3). (B) Morphological analysis of representative H&E stains revealed less alveolar collapse and thickness in opt_sgp130Fc compared with C57BL/6 mice. (C) Interstitial fluid accumulation, measured as capillary-alveolar membrane thickness (n = 5). (D) Lung tissue was removed to measure MPO activity (n = 5). (E) Serum IL-6 concentration (n = 4). (F) Pancreatic tissue was isolated at the indicated times and homogenized to detect p-STAT3Y705. β-Actin served as loading control (representative blot; n = 4 per time point). (G) Morphological analysis of representative H&E stains revealed less pancreatic injury in opt_sgp130Fc compared with C57BL/6 mice. (H and I) Serum analysis showed significantly lower levels of amylase and lipase after 4 and 8 hours in opt_sgp130Fc versus C57BL/6 mice. Results represent mean ± SD. *P < 0.05, **P < 0.005. Scale bars: 50 μm. Boxed regions are shown at higher magnification at right (enlarged ×3).
Figure 4
Figure 4. Classical IL-6 signaling and IL-6 trans-signaling activate different pathways in the pancreas during inflammation.
At 0, 4, and 8 hours, pancreatic tissue from C57BL/6, Il6–/–, and opt_sgp130Fc mice was isolated and homogenized to detect p-STAT3Y705, p-STAT3S727, p-RelA, IκBα, and IκBβ. ERK1/2 served as loading control (representative blot; n = 4 per time point).
Figure 5
Figure 5. Myeloid cells secrete IL-6 in a NF-κB–dependent manner.
(A and B) Immunohistochemical analyses were used to localize p-IκBα (A) and RelA/p65 (B) in pancreas and lung tissues 8 hours after the first injection of cerulein. Positive results for p-IκBα and RelA/p65 in the pancreas (black arrowheads) were mainly restricted to inflammatory cells. Acinar cells remained negative (asterisk). (A) Alveolar cells showed weak activation of p-IκBα. (B) Bronchial epithelium (arrowhead) and infiltrating cells (circle) in the lung harbored nuclear RelA/p65. (C) IHC analyses were used to localize IL-6 in the pancreas and lung. Positive results for IL-6 in the pancreas were strictly restricted to inflammatory cells (black arrows). Alveolar macrophages expressed IL-6 in the lung (white arrows). (D) Myeloid-specific abrogation of RelA/p65 in bone marrow–derived macrophages (BMDM) of RelaF/F and RelAΔmye mice. (E) Pancreatic nuclear protein extracts (10 μg) were subjected to gel retardation assays with an NF-κB consensus binding site (representative EMSA; n = 4). (F) Lung tissue was removed to measure MPO activity (n = 4). (GI) Serum was removed for IL-6 evaluation (G), and levels of Il6 (H) and Cxcl1 (I) mRNA of total pancreatic mRNA were determined, in RelaF/F and RelAΔmye mice. Fold change values (± SD) were normalized to cyclophilin mRNA (n = 4). (J) Pancreases were harvested and homogenized to detect p-STAT3Y705. STAT3 and β-actin served as loading controls (representative blot; n = 4). Results represent mean ± SD. *P < 0.05, **P < 0.005. Scale bars: 50 μm. Boxed regions are shown at higher magnification below (enlarged ×3).
Figure 6
Figure 6. Pancreas-specific p-STAT3Y705 modulates the severity of local inflammation during AP.
(A) Macroscopic images of X-gal–stained liver, pancreas, and small bowel. Microscopic images of nuclear lacZ activity in sections of pancreas, liver, and lung. (B) Pancreases were isolated to detect p-STAT3Y705 during AP. Note the absence of STAT3 activation in Stat3Δpanc mice. STAT3 served as loading control (representative blot; n = 5). Truncated STAT3 protein in the pancreas (STAT3Δpanc) is indicated. (C) Pancreases were subjected to Western blot analysis using a p-STAT3Y705–specific antibody. Note the increased p-STAT3Y705 in Socs3Δpanc mice. STAT3 served as a loading control (representative blot; n = 5 per time point). (D) Morphological analysis of pancreases after 8 hours of AP in the indicated mice. (E) Serum was removed for amylase measurement at the indicated time points. Note the increased release of amylase into the serum in Socs3Δpanc mice, while levels remained lower in Stat3Δpanc mice compared with controls (Stat3F/F and Socs3F/F). (F) Levels of Cxcl1 mRNA of total pancreatic mRNA in control, Stat3Δpanc, and Socs3Δpanc mice. Fold change values (± SD) were normalized to cyclophilin mRNA (n > 3). (G) Early trypsin activation was independent of STAT3 activation (n = 8). (H) Serum IL-6 levels at the indicated time points. Values are mean ± SD for independent animals (n = 5). *P < 0.05, **P < 0.005. Scale bars: 100 μm.
Figure 7
Figure 7. Phosphorylation of STAT3 in the pancreas contributes to systemic complications.
(A) Histological sections of lung tissue from control, Stat3Δpanc, and Socs3Δpanc mice revealed marked hemorrhage and alveolar collapse in Socs3Δpanc mice. (B) MPO activity in lung tissue of control, Stat3Δpanc, and Socs3Δpanc mice at the indicated time points during AP (n = 6). (C) Lung permeability, determined by injection of EBD in the right femoral artery and measurement of dye concentration in lung tissue at 0 and 8 hours (n = 4). (D) Interstitial fluid accumulation, determined by capillary-alveolar membrane thickness. Values represent mean ± SD (n = 10). (E) Lung edema, determined indirectly by the increase in pulmonary fluid accumulation (n = 8). Animals were killed at 8 hours, and the left lung was removed in order to determine the wet/dry ratio (n = 8). (FH) Protein concentration (F), IL-6 (G), and CXCL1 (H) measured in BALF taken from control and experimental animals (n = 4; 1–3 BALF/animal). Note that BALF could not be taken from Socs3Δpanc mice (n.a.), since all mice died due to SAP. (I) p-STAT3Y705 was linked to SAP-induced lethal ALI. Kaplan-Meier curves of control (n = 6), Stat3Δpanc (n = 9), and Socs3Δpanc (n = 5) mice during SAP. Values represent mean ± SD. *P < 0.05, **P < 0.005, ***P < 0.001. Scale bars: 50 μm.
Figure 8
Figure 8. Pharmacological inhibition of STAT3, CXCR2, CXCL1, and IL-6 trans-signaling attenuates SAP-induced lethal ALI.
(A) Kaplan-Meier curves of C57BL/6 mice (black; n = 11) and C57BL/6 mice treated with the CXCR2 antagonist SB225002 (green; n = 12), the STAT3 inhibitor S3I-201 (red; n = 7), recombinant sgp130Fc (blue; n = 8), or an anti-CXCL1 antibody (orange; n = 5) during SAP. (B and C) Serum was removed for amylase and lipase analyses at the indicated time points (n = 4). (D) MPO activity in lung tissue of C57BL/6 mice or treated mice 8 hours after the first cerulein injection (n = 4). (E and F) Histological sections of pancreatic and lung tissue. Note the decrease in lung injury in treated versus C57BL/6 mice. **P < 0.005 versus control. Scale bars: 50 μm (E); 100 μm (F).
Figure 9
Figure 9. IL-6 trans-signaling in patients with AP.
(A) Sampling of blood in individuals with mild AP and SAP after the onset of symptoms. (B and C) Serum IL-6 and sIL-6R levels in control patients and patients with mild AP and SAP. (D) IL-6/sIL-6R ratio. (E) Serum IL-8 levels in control patients and patients with mild AP and SAP. (F) Central role of IL-6 trans-signaling during SAP-associated ALI. Results represent mean ± SD (n > 6). *P < 0.05, **P < 0.005, ***P < 0.001.

References

    1. Whitcomb DC. Clinical practice. Acute pancreatitis. N Engl J Med. 2006;354(20):2142–2150. doi: 10.1056/NEJMcp054958. - DOI - PubMed
    1. Bone RC. Sepsis, the sepsis syndrome, multi-organ failure: a plea for comparable definitions. Ann Intern Med. 1991;114(4):332–333. - PubMed
    1. Hotchkiss RS, Karl IE. The pathophysiology and treatment of sepsis. N Engl J Med. 2003;348(2):138–150. doi: 10.1056/NEJMra021333. - DOI - PubMed
    1. Riedemann NC, Guo RF, Ward PA. Novel strategies for the treatment of sepsis. Nat Med. 2003;9(5):517–524. doi: 10.1038/nm0503-517. - DOI - PubMed
    1. Rinderknecht H. Fatal pancreatitis, a consequence of excessive leukocyte stimulation? Int J Pancreatol. 1988;3(2–3):105–112. - PubMed

Publication types

MeSH terms