. 2013 Mar;123(3):1057-67.
doi: 10.1172/JCI65344. Epub 2013 Feb 15.

Hypoxia-responsive miRNAs target argonaute 1 to promote angiogenesis

Affiliations

Hypoxia-responsive miRNAs target argonaute 1 to promote angiogenesis

Zhen Chen et al. J Clin Invest. 2013 Mar.

Abstract

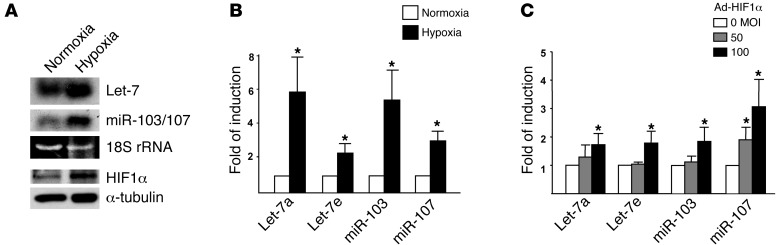
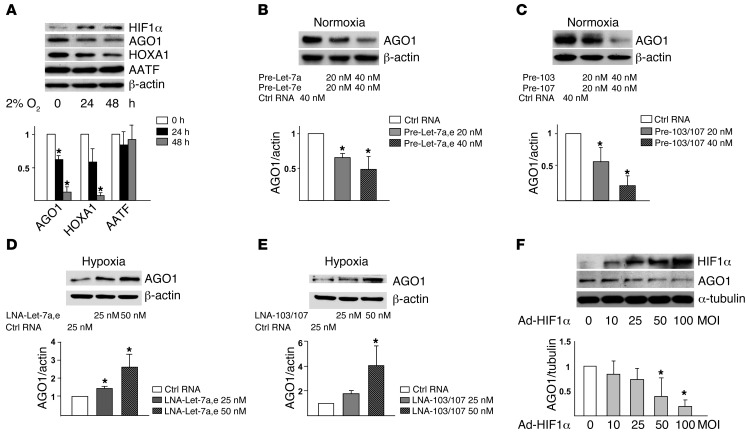
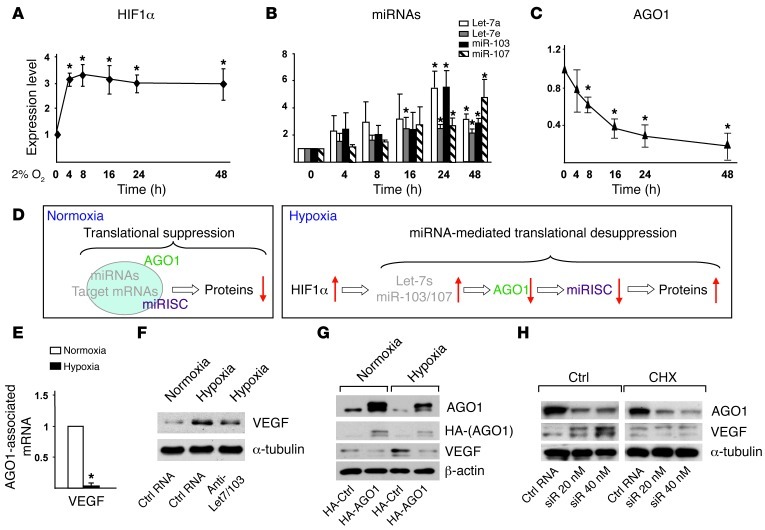
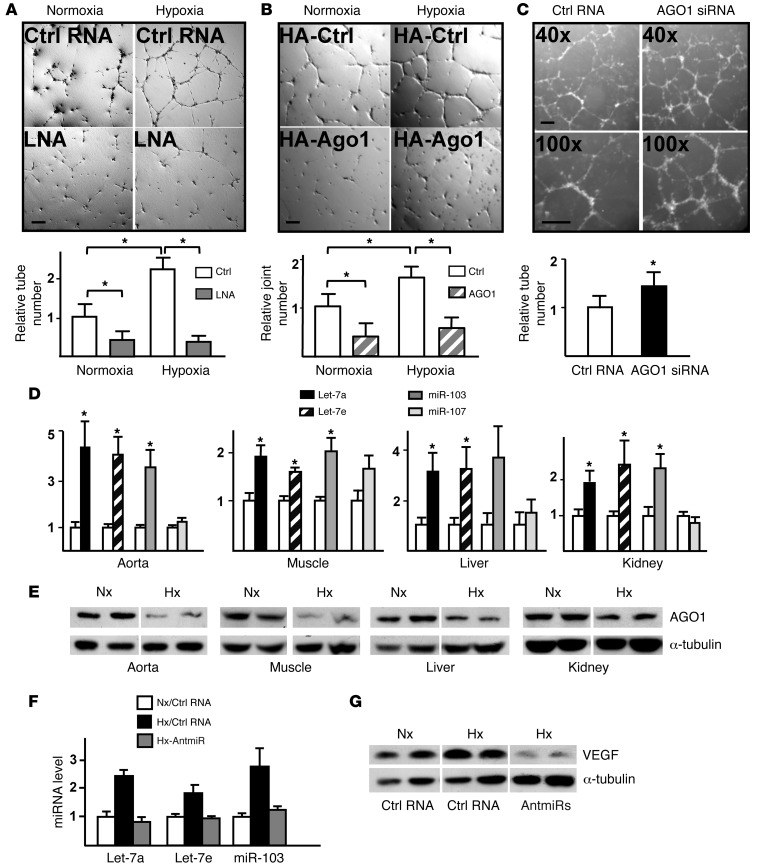
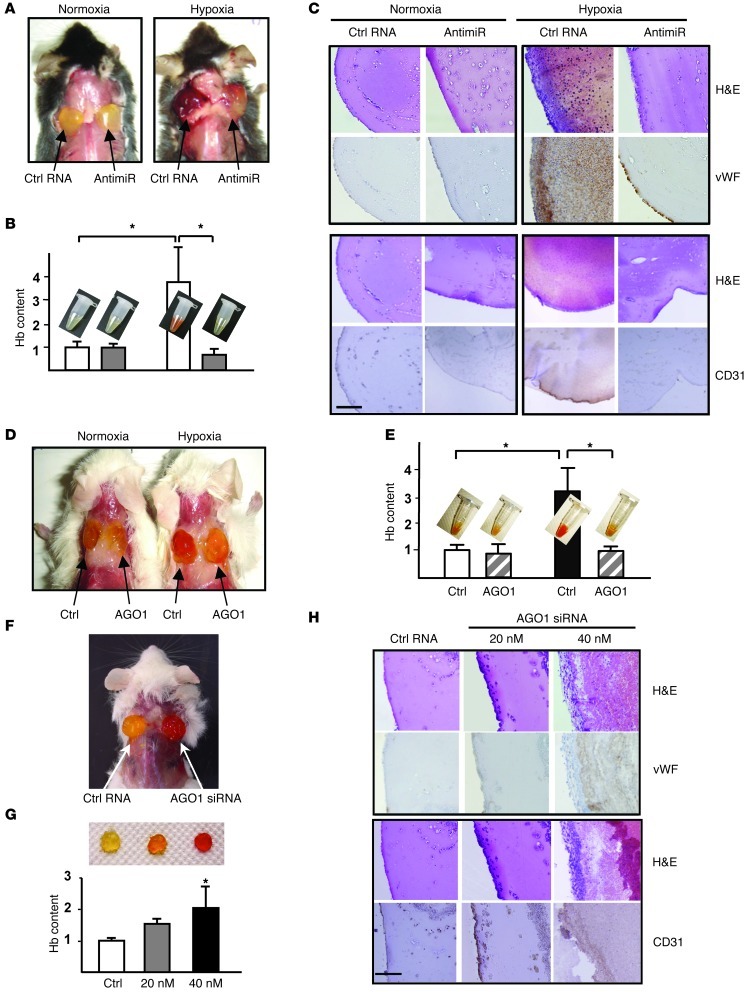
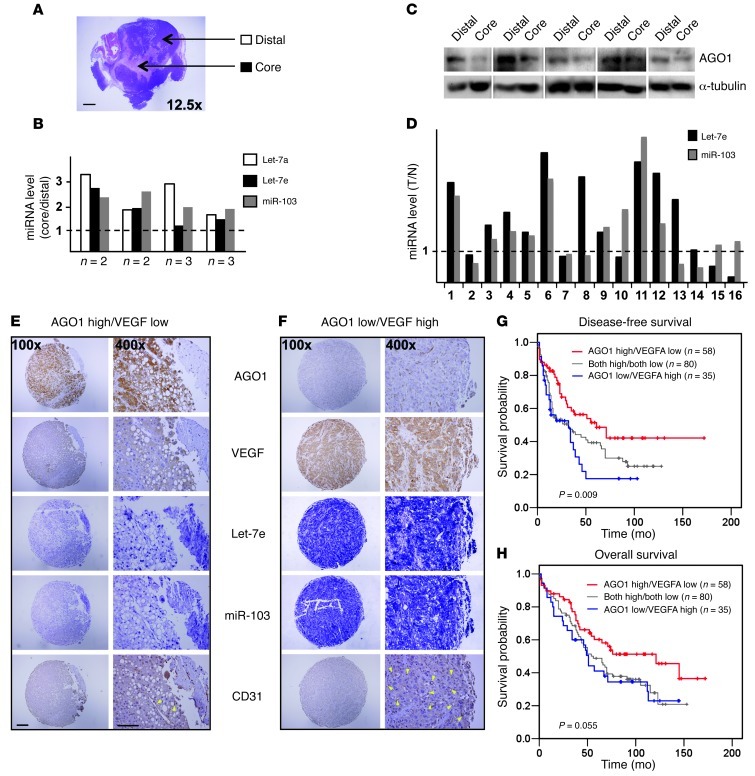
Despite a general repression of translation under hypoxia, cells selectively upregulate a set of hypoxia-inducible genes. Results from deep sequencing revealed that Let-7 and miR-103/107 are hypoxia-responsive microRNAs (HRMs) that are strongly induced in vascular endothelial cells. In silico bioinformatics and in vitro validation showed that these HRMs are induced by HIF1α and target argonaute 1 (AGO1), which anchors the microRNA-induced silencing complex (miRISC). HRM targeting of AGO1 resulted in the translational desuppression of VEGF mRNA. Inhibition of HRM or overexpression of AGO1 without the 3' untranslated region decreased hypoxia-induced angiogenesis. Conversely, AGO1 knockdown increased angiogenesis under normoxia in vivo. In addition, data from tumor xenografts and human cancer specimens indicate that AGO1-mediated translational desuppression of VEGF may be associated with tumor angiogenesis and poor prognosis. These findings provide evidence for an angiogenic pathway involving HRMs that target AGO1 and suggest that this pathway may be a suitable target for anti- or proangiogenesis strategies.


Figures

Figure 1
Figure 1. Hypoxia induces Let-7 and miR-103/107 in ECs.
(A and B) HUVECs were kept under normoxia (21% O2) or were subjected to hypoxia (2% O2) for 24 hours. (A) Northern blotting analysis of Let-7 and miR-103/107 expression. 18S rRNA was detected as loading control. (B) The indicated miRNAs were detected by TaqMan qPCR. The relative expression was normalized to that of U6 RNA, with that of normoxia set as 1. (C) HUVECs were infected with Ad-HIF1α for 72 hours, and miRNAs were quantified by TaqMan qPCR. The relative level of miRNA expression was compared with that of the mock-infected group (0 MOI), set as 1. Bar graphs represent mean ± SD from 3 independent experiments. *P < 0.05 compared with normoxia in B or mock-infected controls in C.
Figure 2
Figure 2. Let-7 and miR-103/107 target AGO1.
(A) HUVECs were subjected to normoxia (time 0) or hypoxia for the indicated times. Cell lysates underwent SDS-PAGE, then Western blot analysis with various antibodies. (B and C) HUVECs were transfected under normoxia for 72 hours with control RNA, pre–Let-7a and pre–Let-7e, or pre-103 and pre-107, at 20 or 40 nM each. Western blot analysis was performed to assess the AGO1 level. (D and E) HUVECs were transfected with LNAs inhibiting Let-7a and Let-7e or miR-103 and miR-107 at indicated concentrations for 48 hours before 24-hour hypoxic stress. Western blot analysis was performed to assess the level of AGO1. (F) Western blot analysis of AGO1 level in HUVECs infected with Ad-HIF1α. Relative protein expression was obtained by normalizing to that of β-actin or α-tubulin. Bar graphs represent mean ± SD from 3 independent experiments. *P < 0.05 versus respective controls set to 1.
Figure 3
Figure 3. Posttranscriptional targeting of AGO1 mRNA in AGO1-mediated miRISC.
(A) HEK293 cells were transfected with the WT Luc-AGO1–3′ UTR (WT), Luc-AGO1–3′ UTR with miR-103/107 or Let-7 target sites mutated (mut), or Luc-AGO2–3′ UTR, together with pre–Let-7e (40 nM), pre-103 (40 nM), pre–Let-7e and pre-103 (20 nM each), or control RNA (40 nM). (B) Bovine aortic ECs (BAECs) transfected with Luc-AGO1–3′ UTR or -AGO2–3′ UTR were subjected to normoxia (Nx) or hypoxia (Hx). CMV–β-gal was cotransfected in all groups as a transfection control. Luciferase activity was normalized to that of β-gal. (CG) HUVECs were subjected to normoxia or hypoxia. (C and D) Western blot and qPCR analyses of protein and mRNA levels of AGO1–3. (EG) AGO1 was immunoprecipitated from cell lysates. The immunoprecipitates were subjected to AGO1 immunoblotting (F) and the AGO1-associated miRNAs and AGO1 mRNA were quantified by qPCR (E and G). Data represent mean ± SD from 3 independent experiments. *P < 0.05 compared with control RNA group in A or normoxia group in BG.
Figure 4
Figure 4. Translational desuppression of VEGF caused by AGO1 targeting.
(AC) HUVECs were subjected to normoxia or hypoxia for the indicated times. Western blot analysis of protein levels of HIF1α (A) and AGO1 (C) and TaqMan qPCR analysis of miRNAs (B). (D) Model of translational suppression under normoxia and desuppression under hypoxia. Red arrows indicate up- or downregulation of various molecules. (E) AGO1-associated mRNAs were enriched by IP. Level of VEGF was detected by qPCR. (F) HUVECs were transfected with a mixture of anti–Let-7a/e/miR-103 (10 nM each) or control RNA (30 nM). (G) HUVECs were transfected with a control vector expressing HA or HA-AGO1-ORF plasmid containing AGO1 ORF without 3′ UTR. (H) HUVECs were transfected with AGO1 siRNA or control RNA for 48 hours, then treated with vehicle control or cycloheximide (CHX) (5 μg/ml) for 4 hours. Cells in FH were then subjected to hypoxia or kept as normoxia controls, and various proteins were detected by Western blot analysis. *P < 0.05 compared with normoxia group.
Figure 5
Figure 5. HRM/AGO1 pathway mediates hypoxia-induced angiogenesis in vitro and responds to hypoxia in vivo.
(AC) HUVECs were prepared as described in Figure 4, F–H, and underwent in vitro angiogenesis assays. The tube/joint numbers were counted, with normoxia/control RNA group (A), normoxia/control plasmid group (B), or control RNA group (C) set to 1. Scale bar: 100 μm. (D and E) C57BL/6 mice were subjected to hypoxia (10% O2) or normoxia (21% O2) for 5 days. Let-7 and miR-103/107 expression in multi-organs/tissues was detected by TaqMan miRNA qPCR (D) and AGO1 protein level by Western blot analysis (E). The levels of miRNAs in normoxia were set to 1. (F and G) Control RNA or antagomirs (antmiR) were delivered with pluronic gel to hind-limb muscles of C57BL/6 mice and then kept under normoxia or hypoxia for 5 days. The miRNAs in the hind limbs were quantified by qPCR (F) and VEGF by Western blot analysis (G). (DG) Data represent results from at least 6 animals per group. *P < 0.05 compared with controls or between indicated groups.
Figure 6
Figure 6. HRM/AGO1 pathway regulates hypoxia-induced angiogenesis in vivo.
(AC) Matrigel mixed with control RNA (15 μg/plug) or antagomirs against Let-7a, Let-7e, and miR-103 (5 μg/plug each) was injected s.c. into C57BL/6 mice before 5-day normoxia or hypoxia. Gross morphology (A) and Hb quantification (B) as well as H&E, vWF, and CD31 staining of Matrigel plugs (C). (D and E) HUVECs transfected with control or HA-AGO1-ORF plasmid were mixed with Matrigel and s.c. injected into SCID mice, which were then kept under normoxia or hypoxia for 3 days. Gross morphology (D) was photographed and Hb quantified (E). (FH) HUVECs transfected with control RNA (40 nM) or AGO1 siRNA (20 or 40 nM) were mixed with Matrigel and s.c. injected into SCID mice. Five days after injection, the plugs were harvested for gross morphology (F), Hb quantification (G), histology, and IHC (H). In C, E, and G, the Hb content in normoxia/control RNA or control plasmid group was set to 1. Bar graphs represent mean ± SEM. Results are from 5–10 animals per group. Scale bar: 100 μm. *P < 0.05 compared with controls or between indicated groups.
Figure 7
Figure 7. Implication of HRM-mediated VEGF desuppression in tumorigenesis.
(AC) Mammary fat pads of SCID mice were implanted with 5 × 10⁵ MDA-MB-231 human breast cancer cells. After 4 weeks, mice were killed and tumors were harvested. Core regions of necrotic tumors and distal areas shown in A were collected for detection of miRNAs (B) and AGO1 protein (C). Scale bar: 2 mm. (B) Specimens collected from 10 animals were pooled into 4 samples (each containing 2 or 3 specimens as indicated) for miRNA qPCR. Bars represent the ratio of miRNA level in the core relative to that in the distal region. (C) Representative images of Western blot analysis with samples from individual mice. (D) Levels of Let-7e and miR-103 was detected in paired normal (N) and tumor (T) tissues, and the T/N expression ratio was calculated. (E and F) Representative IHC staining of AGO1, VEGF, CD31, and ISH of Let-7e and miR-103 in serial sections from patients with AGO1 high/VEGF low (E) and AGO1 low/VEGF high expression patterns (F). Scale bar: 200 μm (×100); 100 μm (×400). Yellow arrowheads indicate the location of microvessels. (G and H) Kaplan-Meier analysis of disease-free (G) and overall survival (H) for 173 HCC patients, stratified by AGO1 and VEGF expression.

References

    1. Manalo DJ, et al. Transcriptional regulation of vascular endothelial cell responses to hypoxia by HIF-1. Blood. 2005;105(2):659–669. doi: 10.1182/blood-2004-07-2958. - DOI - PubMed
    1. Semenza GL. Hypoxia-inducible factor 1 (HIF-1) pathway. Sci STKE. 2007;2007(407):cm8. doi: 10.1126/stke.4072007cm8. - DOI - PubMed
    1. Wenger RH, Stiehl DP, Camenisch G. Integration of oxygen signaling at the consensus HRE. Sci STKE. 2005;2005(306):re12. doi: 10.1126/stke.3062005re12. - DOI - PubMed
    1. Kenneth NS, Rocha S. Regulation of gene expression by hypoxia. Biochem J. 2008;414(1):19–29. doi: 10.1042/BJ20081055. - DOI - PubMed
    1. Arany Z, et al. HIF-independent regulation of VEGF and angiogenesis by the transcriptional coactivator PGC-1alpha. Nature. 2008;451(7181):1008–1012. doi: 10.1038/nature06613. - DOI - PubMed

Publication types

MeSH terms