. 2013 Apr 5;288(14):9933-9945.
doi: 10.1074/jbc.M112.441493. Epub 2013 Feb 20.

Phosphorylation of lipin 1 and charge on the phosphatidic acid head group control its phosphatidic acid phosphatase activity and membrane association

Affiliations

Phosphorylation of lipin 1 and charge on the phosphatidic acid head group control its phosphatidic acid phosphatase activity and membrane association

James M Eaton et al. J Biol Chem. .

Abstract

The lipin gene family encodes a class of Mg(2+)-dependent phosphatidic acid phosphatases involved in the de novo synthesis of phospholipids and triglycerides. Unlike other enzymes in the Kennedy pathway, lipins are not integral membrane proteins, and they need to translocate from the cytosol to intracellular membranes to participate in glycerolipid synthesis. The movement of lipin 1 within the cell is closely associated with its phosphorylation status. Although cellular analyses have demonstrated that highly phosphorylated lipin 1 is enriched in the cytosol and dephosphorylated lipin 1 is found on membranes, the effects of phosphorylation on lipin 1 activity and binding to membranes has not been recapitulated in vitro. Herein we describe a new biochemical assay for lipin 1 using mixtures of phosphatidic acid (PA) and phosphatidylethanolamine that reflects its physiological activity and membrane interaction. This depends on our observation that lipin 1 binding to PA in membranes is highly responsive to the electrostatic charge of PA. The studies presented here demonstrate that phosphorylation regulates the ability of the polybasic domain of lipin 1 to recognize di-anionic PA and identify mTOR as a crucial upstream signaling component regulating lipin 1 phosphorylation. These results demonstrate how phosphorylation of lipin 1 together with pH and membrane phospholipid composition play important roles in the membrane association of lipin 1 and thus the regulation of its enzymatic activity.


Figures

FIGURE 1.
FIGURE 1.
Phosphorylation status of lipin 1 does not change PAP activity using the conventional Triton X-100 mixed micelle assay. A, HEK293T cells were transfected with an expression vector for FLAG-tagged lipin 1b. Two days after transfection the cells were homogenized in buffer A, and the lipin 1 contained in the extracts was bound to FLAG beads. After washing in buffer B, the beads were suspended in phosphatase buffer and treated with (+λ) or without (−λ) λ-phosphatase for 30 min. After further washing, the lipin 1 was eluted with 0.5 mg/ml FLAG peptide and quickly dialyzed. A representative 8.75% acrylamide SDS-PAGE gel stained with Coomassie is shown. μg of BSA are indicated. B, HEK293T cells were transfected as in A and radiolabeled with 0.02 μCi/ml [32P]ATP in low phosphate buffer containing 10% serum for 2 h before protein isolation. The radiolabeled lipin 1 contained within the protein extracts was immunoprecipitated with FLAG beads, washed, then treated or not with λ-phosphatase as in A. After phosphatase treatment, lipin 1 was eluted by boiling in SDS load buffer, resolved by SDS-PAGE, and transferred to membrane. Radiolabeled lipin 1 was visualized by autoradiography, and the membrane was subjected to immunoblotting to detect total lipin 1. C, PAP enzymatic activity from 50 ng of phosphorylated (−λ) and dephosphorylated lipin 1 (+λ) was measured as a function of time in Tris-maleate buffer, pH 7.0, with 9.1 mol% PA in Triton X-100 micelles at a final concentration of 0.2 mm PA. D, phosphorylated (−λ) and dephosphorylated (+λ) lipin 1 PAP activity was measured as a function of PA concentration in 100 nm PC:PA liposomes at pH 7.5. The surface concentration of PA was 10 mol%.
FIGURE 2.
FIGURE 2.
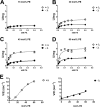
PAP activity of phosphorylated and dephosphorylated lipin 1 in liposomes. A, phosphorylated (−λ) and dephosphorylated (+λ) lipin 1 PAP activity was measured as a function of the molar concentration of PA in 100 nm PC:PE:PA (75:15:10) mol% liposomes at pH 7.5. B, lipin 1 PAP activity was measured as in A but with liposomes made with PC:PE:PA (60:30:10 mol%). C, lipin 1 PAP activity was measured as in A but with liposomes made with PC:PE:PA (45:45:10 mol%). D, lipin 1 PAP activity was measured as in A but with liposomes made with PC:PE:PA (30:60:10 mol%). E, shown is graph of kcat values from Table 1 plotted as a function of the mol% PE for Dephosphorylated lipin 1 (left) and phosphorylated lipin 1 (right). U, units.
FIGURE 3.
FIGURE 3.
Effect of PC or PE on lipin 1 physical association with liposomes. A, phosphorylated (−λ) lipin 1 was mixed in buffer B with PC liposomes containing PA at 20 mol% and the indicated concentrations of PE replacing PC or PE:PC liposomes without PA. After 20 min of incubation, the lipin 1-liposome mixture was subjected to liposome floatation, and the amount of lipin 1 recovered after floatation was measured. The graph illustrates the amount of lipin 1 bound to liposomes as a percent of the total amount of lipin 1 in the binding reaction ± S.D. Each binding assay was performed at least three times, and the asterisk indicates p < 0.05 when comparing PC:PA liposomes with 40% PC:PE:PA liposomes and PC:PE liposomes. Right, shown is a representative immunoblot of lipin 1 (anti-FLAG) recovered after floatation. Input is 20% of the amount incubated with the liposomes. B, dephosphorylated (+λ) lipin 1 binding to PC:PE:PA liposomes was measured as described in A. Each binding assay was performed at least three times, and the asterisk indicates p < 0.05 when comparing PC:PA liposomes with 30 and 40% PC:PE:PA liposomes and PC:PE liposomes
FIGURE 4.
FIGURE 4.
Effect of amphiphilic amines on lipin 1 association with membranes and PAP activity. A, shown is dephosphorylated lipin 1 (+λ) binding to liposomes containing the indicated mol% concentration of dodecylamine and dodecyltrimethylammonium. Binding assay was performed by flotation as described in Fig. 3A. Each binding assay was performed at least three times, and the asterisk indicates p < 0.05 when comparing PC:PA liposomes with PC:PA liposomes containing 10 and 20 mol% dodecylamine. Bottom, shown is a representative immunoblot of lipin 1 (anti-FLAG) recovered after floatation at the indicated concentrations of chlorpromazine. B, shown is phosphorylated (−λ) and dephosphorylated (+λ) lipin 1 PAP activity using 100 nm PC:PA liposomes containing PA at 10 mol% and chlorpromazine at 10 mol%. PAP assays were performed as a function of PA molar concentration at pH 7.5. C, dephosphorylated lipin 1 (+λ) binding to liposomes was performed as described in Fig. 3A but with the indicated mol% of chlorpromazine.
FIGURE 5.
FIGURE 5.
Effect of pH on lipin 1 PAP activity. A–C, phosphorylated (−λ) and dephosphorylated (+λ) lipin 1 PAP activity using Triton X-100 mixed micelles containing 9.1 mol% PA was measured as a function of the molar concentration of PA in at the indicated pH. D, phosphorylated (−λ) and dephosphorylated (+λ) lipin 1 PAP activity using Triton X-100 mixed micelles containing 1 mm final concentration of PA was measured as a function of the surface concentration of PA (mol%) at pH 8.0. The surface concentration of PA was 2, 4, 5, 6, 7, 8, and 10 mol%. E, phosphorylated (−λ) and dephosphorylated lipin 1 (+λ) binding to 100 nm PC:PA liposomes at pH 7.2 and 8.0 were performed as described in Fig. 3A. Input is 20% of the amount incubated with the liposomes. Each binding assay was performed at least three times, and the asterisk indicates p < 0.05 when comparing binding between pH 7.2 and pH 8.0 for both +λ and −λ. Right, shown is a representative immunoblot of lipin 1 (anti-FLAG) recovered after floatation at the indicated pH.
FIGURE 6.
FIGURE 6.
Effect of mTOR inhibition and Ser/Thr mutation to A on lipin 1 PAP activity. A, HEK293T cells were transfected with FLAG-tagged wild type lipin 1 or the 21xA mutant. Two days after transfection the cells were homogenized in buffer A, and lipin 1 was purified as described in Fig. 1A. While the protein was still attached to the FLAG beads, the wild type was treated with λ-phosphatase (WT +λ), whereas the 21xA mutant was not (21xA −λ). PAP activity was measured in TX/PA micelles (9.1 mol% PA) as a function of PA molar concentration at pH 8.0. The inset to the right is an SDS-PAGE gel of purified lipin 1 treated with phosphatase (WT +λ) and the lipin 1 21xA mutant untreated (21xA −λ) stained with Coomassie. U, units. B, HEK293T cells were transfected for 48 h with an expression vector for FLAG-tagged lipin 1b. 250 nm torin1 was added (WT+Torin) or not 16 h before the cells were homogenized in buffer A, and the lipin 1 contained in the extracts was bound to FLAG beads, purified, and treated with or without λ-phosphatase (WT +λ, WT −λ) as described in Fig. 1A. PAP activity was measured in TX/PA micelles (9.1 mol% PA) as a function of PA molar concentration at pH 8.0. The inset to the right is a SDS-PAGE gel of purified lipin 1 +/−λ-phosphatase and lipin 1 treated with torin1 stained with Coomassie.
FIGURE 7.
FIGURE 7.
Role of the PBD in lipin 1 PAP activity. A, HEK293T cells were transfected with FLAG-tagged PBD mutant of lipin 1. Two days after transfection the cells were homogenized in buffer A and the PBD mutant of lipin 1 (PBD) was purified and treated with λ-phosphatase or not as described in Fig. 1A. PAP activity for dephosphorylated (PBD +λ) or phosphorylated (PBD −λ) PBD mutant was measured in PC:PA liposomes (90:10) mol% as a function of PA molar concentration at pH 7.5, as described in Fig. 1D. The inset within the graph are the data from wild type lipin 1 taken from Fig. 1D and shown for convenience. The inset to the right is a SDS-PAGE gel of purified lipin 1-PBD +/− λ-phosphatase stained with Coomassie. mU, milliunits. B, PAP activity for dephosphorylated (PBD +λ) or phosphorylated (PBD −λ) PBD mutant was measured in PC:PE:PA liposomes (60:30:10) mol% as a function of PA molar concentration at pH 7.5 as described in Fig. 2B. The inset within the graph are the data from WT lipin 1 taken from Fig. 2B and shown for convenience. C, phosphorylated (−λ) and dephosphorylated (+λ) PBD mutant binding to 100 nm PC:PE:PA liposomes (40:40:20 mol%) at pH 7.2 was performed as described in Fig. 3A. Input is 20% that of the amount incubated with the liposomes. Each binding assay was performed at least three times. Bottom, shown is a representative immunoblot of the PBD mutant (anti-FLAG) recovered after floatation.
FIGURE 8.
FIGURE 8.
Model representation of lipin 1 binding to PA. Phosphorylated Ser/Thr residues are identified by number, where brackets indicate either or both residues may be phosphorylated, NLIP and CLIP are conserved NH2- and COOH-LIP in homology domains, HAD is haloacid dehalogenase-like domain identified by DxDxT, NLS/PBD is the nuclear localization sequence/polybasic domain with the sequence shown below, SRD is the serine-rich domain previously identified to bind to 14-3-3, and b is the 33-amino acid alternatively spliced exon.

References

    1. Han G. S., Wu W. I., Carman G. M. (2006) The Saccharomyces cerevisiae Lipin homolog is a Mg2+-dependent phosphatidate phosphatase enzyme. J. Biol. Chem. 281, 9210–9218 - PMC - PubMed
    1. Péterfy M., Phan J., Xu P., Reue K. (2001) Lipodystrophy in the fld mouse results from mutation of a new gene encoding a nuclear protein, lipin. Nat. Genet. 27, 121–124 - PubMed
    1. Harris T. E., Finck B. N. (2011) Dual function lipin proteins and glycerolipid metabolism. Trends Endocrinol. Metab. 22, 226–233 - PMC - PubMed
    1. Harris T. E., Huffman T. A., Chi A., Shabanowitz J., Hunt D. F., Kumar A., Lawrence J. C., Jr. (2007) Insulin controls subcellular localization and multisite phosphorylation of the phosphatidic acid phosphatase, lipin 1. J. Biol. Chem. 282, 277–286 - PubMed
    1. Peterson T. R., Sengupta S. S., Harris T. E., Carmack A. E., Kang S. A., Balderas E., Guertin D. A., Madden K. L., Carpenter A. E., Finck B. N., Sabatini D. M. (2011) mTOR complex 1 regulates lipin 1 localization to control the SREBP pathway. Cell 146, 408–420 - PMC - PubMed

Publication types

MeSH terms