. 2013 Feb 20;33(8):3706-24.
doi: 10.1523/JNEUROSCI.4067-12.2013.

Tuning and timing in mammalian type I hair cells and calyceal synapses

Affiliations

Tuning and timing in mammalian type I hair cells and calyceal synapses

Jocelyn E Songer et al. J Neurosci. .

Abstract

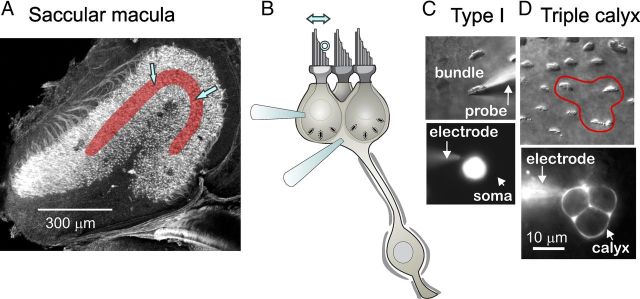
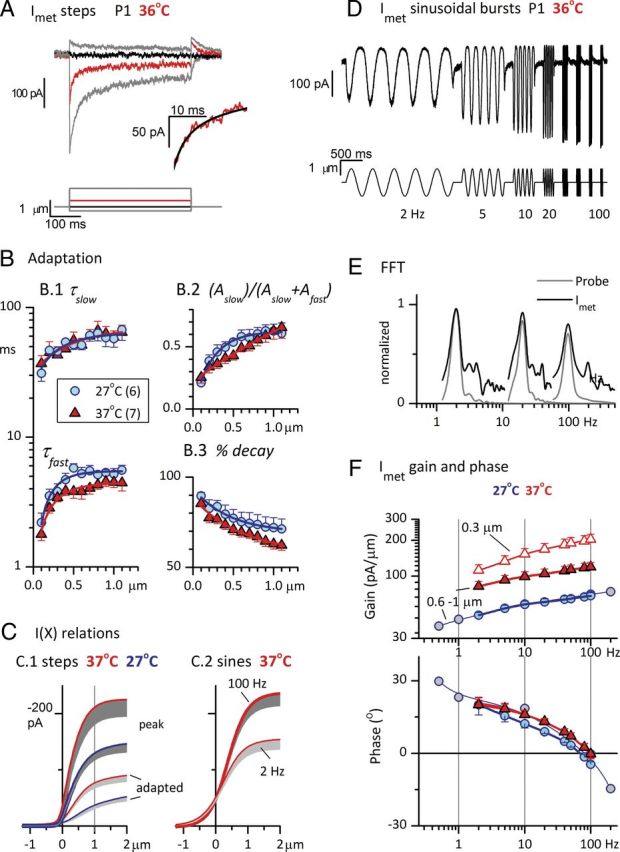
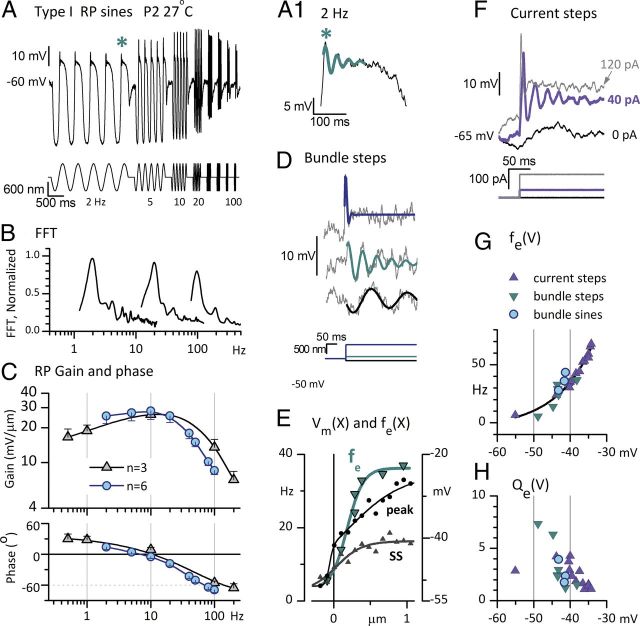
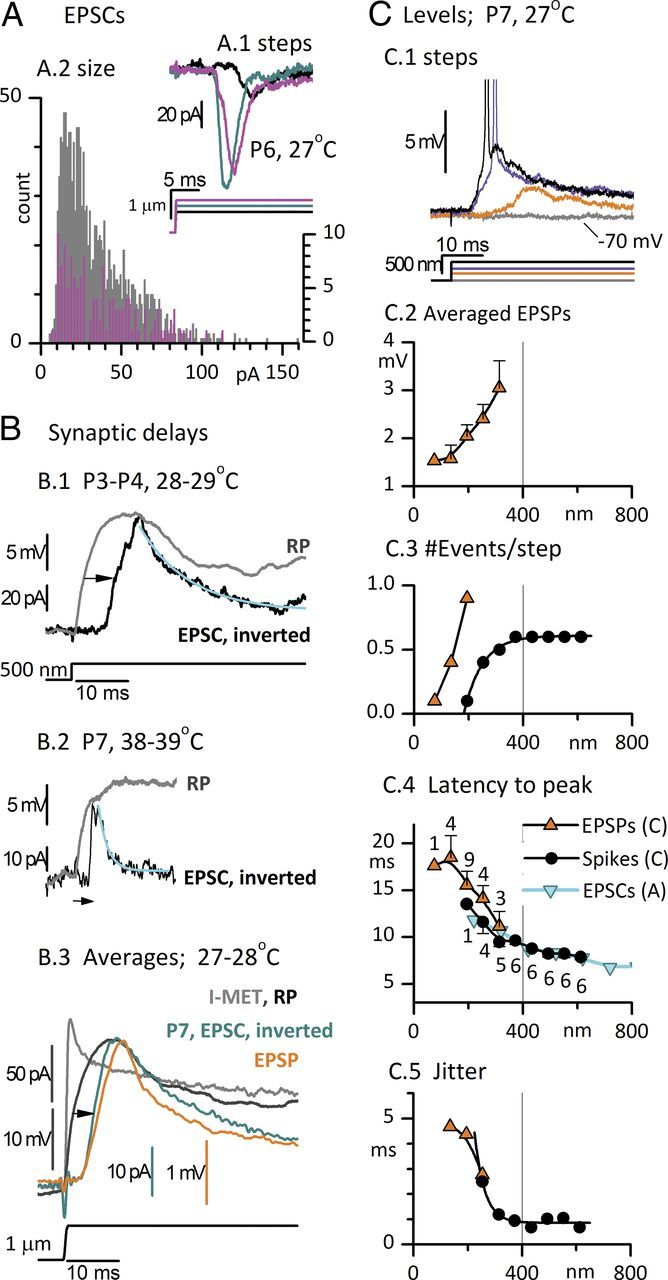
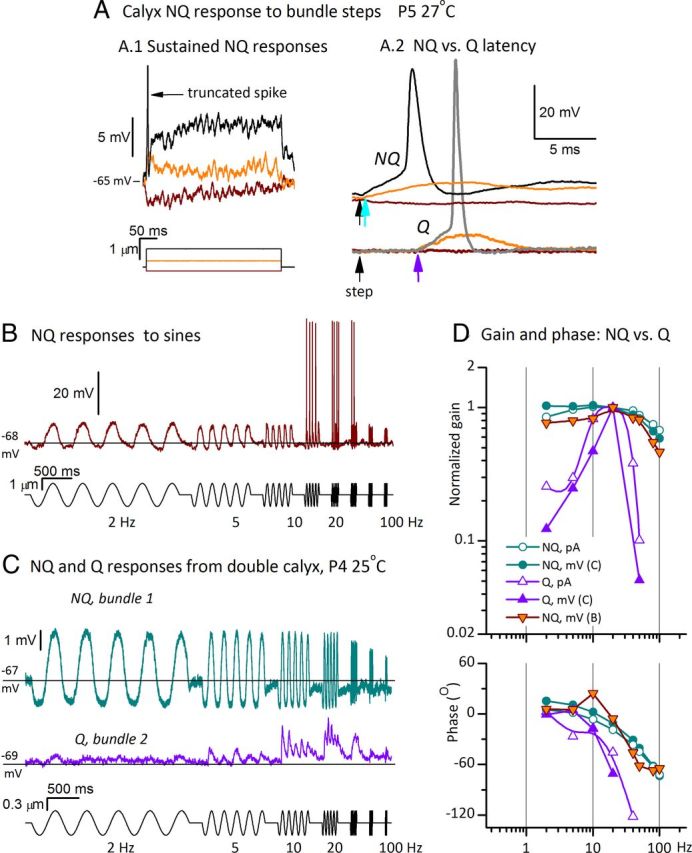
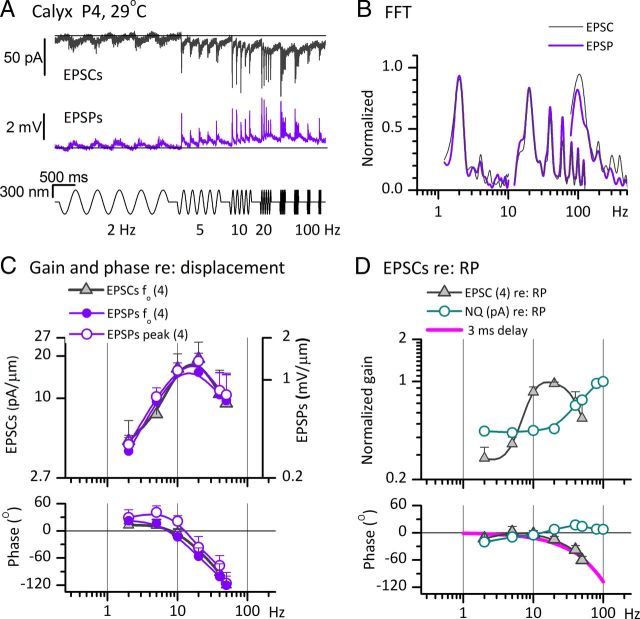
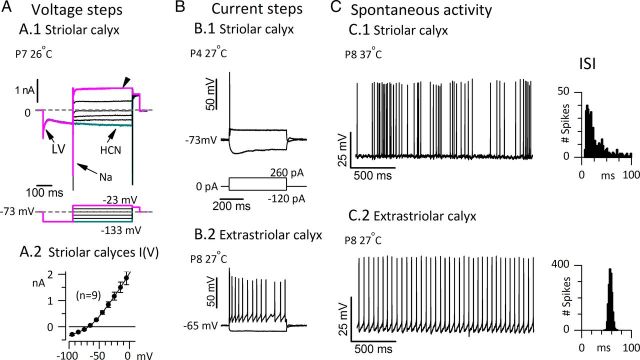
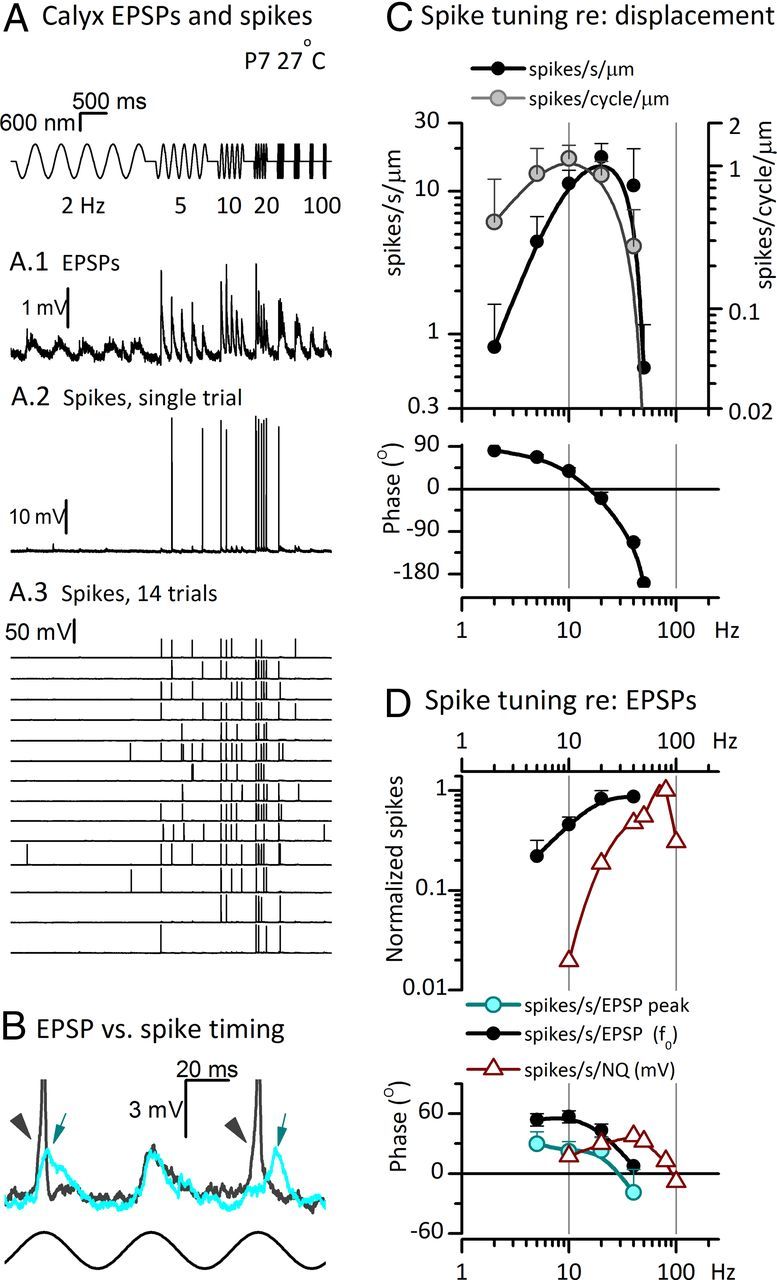
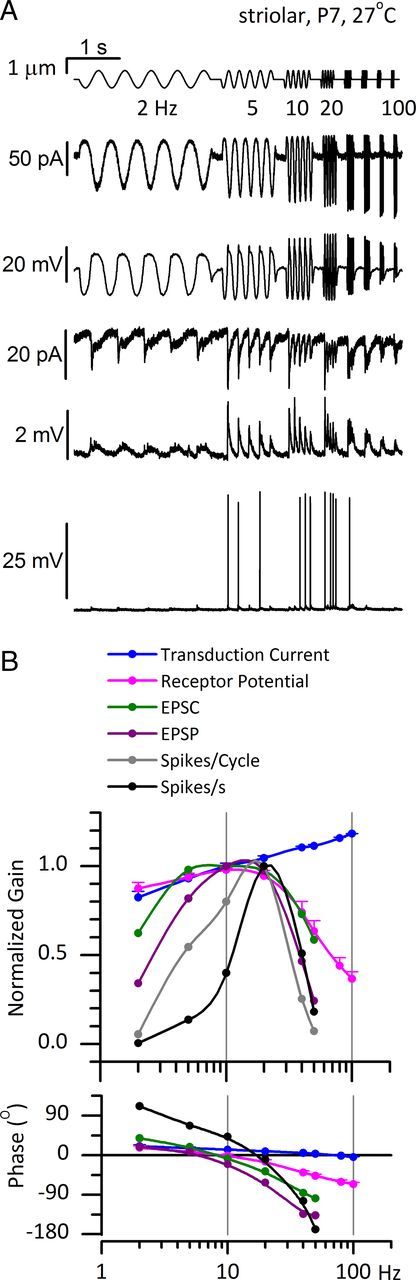
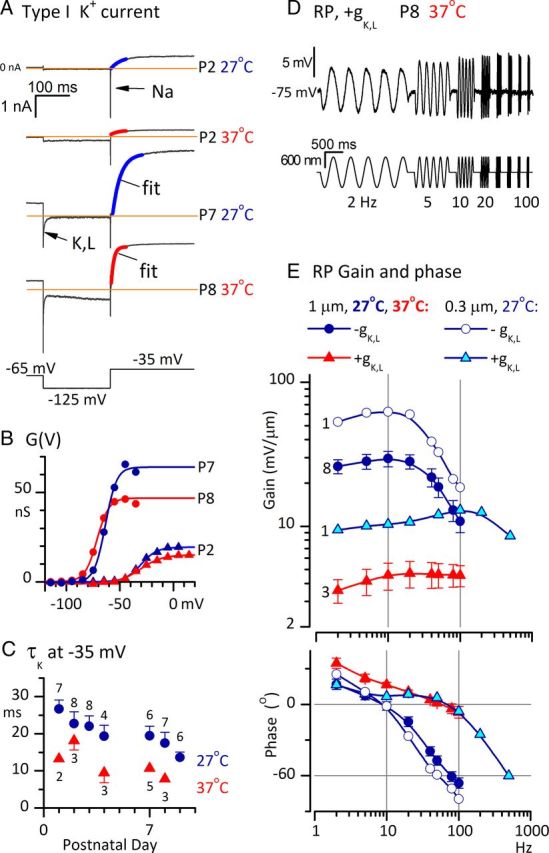
Afferent nerve fibers in the central zones of vestibular epithelia form calyceal endings around type I hair cells and have phasic response properties that emphasize fast head motions. We investigated how stages from hair-cell transduction to calyceal spiking contribute tuning and timing to central (striolar)-zone afferents of the rat saccular epithelium. In an excised preparation, we deflected individual hair bundles with rigid probes driven with steps and sinusoids (0.5-500 Hz) and recorded whole-cell responses from hair cells and calyces at room temperature and body temperature. In immature hair cells and calyces (postnatal days (P)1-P4), tuning sharpened at each stage. Transducer adaptation and membrane-charging time produced bandpass filtering of the receptor potential with best frequencies of 10-30 Hz and phase leads below 10 Hz. For small stimuli, electrical resonances sharply tuned the hair-cell membrane in the frequency range of 5-40 Hz. The synaptic delay of quantal transmission added a phase lag at frequencies above 10 Hz. The influence of spike thresholds at the calyceal spike initiation stage sharpened tuning and advanced response phase. Two additional mechanisms strongly advanced response phase above 10 Hz when present: (1) maturing (P7-P9) type I hair cells acquired low-voltage-activated channels that shortened the rise time of the receptor potential and (2) some calyces had nonquantal transmission with little synaptic delay. By reducing response time, the identified inner-ear mechanisms (transducer adaptation, low-voltage-activated channels, nonquantal transmission, and spike triggering) may compensate for transmission delays in vestibular reflex pathways and help stabilize posture and gaze during rapid head motions.


Figures

Figure 1.
Figure 1.
Recording from hair cells and calyceal afferent terminals in the rat saccular epithelium. A, Confocal image of the saccular epithelium excised from a P2 rat (modified from Fig. 2C in Eatock and Songer, 2011). The striolar zone is overlaid with red; most recordings were made from the region between the two blue arrows. The tissue was stained with phalloidin, which labels the actin-based hair bundles, with antibodies to β3-tubulin, which labels all nerve fibers, and with calretinin, which labels type II hair cells and calyx-only striolar nerve fibers. B, Schematic, illustrating a “triple” calyx around three type I hair cells, shows two recording electrodes, one on a hair cell and one on the calyx. Just one recording electrode was used at a time. A stimulus probe (open circle) was positioned against the staircase edge of the hair bundle to deflect it along its most sensitive axis (double arrow above bundle) while recordings were made in whole-cell patch-clamp mode from either the type I hair cell or its postsynaptic calyx. C, Stimulation and recording from a striolar type I hair cell, as viewed from above with differential-interference-contrast or fluorescence optics. Top, The hair bundle was deflected along its sensitive axis with a rigid glass probe. Bottom, The soma below the hair bundle, filled with fluorescent rhodamine diffused in from the recording pipette (electrode). Scale bar in D applies to C. D, Recording from a triple calyx, as viewed from above. Top, The hair bundles of the three type I hair cells within the calyx are outlined (red). Bottom, The recording electrode has filled the triple calyx terminal with rhodamine.
Figure 2.
Figure 2.
Effects of adaptation and temperature on sensitivity (gain) and timing (phase) of Imet. Data were collected in two temperature ranges: 25–29°C (blue symbols) and 35–39°C (red symbols). For pooled data, we abbreviate these ranges to their midpoints, “27°C” and “37°C”, in this and subsequent figures. A, Step deflections (bottom) of the hair bundle evoked rapidly adapting transduction currents in a P1 striolar type I hair cell at 36°C. Red trace, The response to a step at the midpoint of the operating range, X1/2. Inset, The first 20 ms following the step to X1/2. Black curve, Double-exponential fit (Eq. 3; τfast = 2.7 ms, τslow = 15.9 ms, Iss = −51 pA, Aslow = −49 pA, Afast = −72 pA). B, Parameters of adaptation as functions of hair-bundle displacement, at two different temperature ranges. Averages for six striolar type I hair cells at 27°C and seven striolar type I hair cells at 37°C. B.1, Fast and slow time constants from double-exponential fits (Eq. 3; fit shown in A, black curve, inset). τfast values were significantly faster at 37°C. B.2, The relative importance of slow adaptation increased with bundle displacement. The amplitude of the slow adaptation term (Aslow, Eq. 3) is divided by the sum of the amplitudes of the fast and slow terms and plotted against bundle displacement. This fraction increased similarly with level at both temperatures; slow adaptation accounted for 20% of the adaptation (decay) at the smallest displacements and 60–70% at the largest displacements. B.3, Percentage decay (extent of adaptation, Eq. 4) at steady state, as estimated by the double-exponential fits, decreased with displacement, and was smaller at every displacement at 37°C than at 27°C. C, Effects of adaptation and temperature on I(X) relations. Averaged I(X) relations were derived from steps (C.1, same cells as in B) and sinusoidal burst data (C.2). Step data (C.1): I(X) relations for peak and steady-state currents were fit with Equation 2 and averaged to produce mean and SEM values (gray shading, −1 SEM) (see Table 1 for fit values). Thick lines with dark shading, Peak (onset) Imet. Thin lines with light shading, Adapted (steady state) responses. Sinusoidal burst data (C.2, same axes): I(X) relations were point-by-point plots of Imet against X for the rising half-cycle of the sinusoidal burst, averaged across all five cycles in the burst. Shown are mean − SEM values of first-order Boltzmann fits (Eq. 1) for 100 Hz fits (thick line, n = 12) and 2 Hz fits (thin line, n = 10) at 35–39°C; see Table 1 for fit values. D, Imet (top, average of 5 traces) from the same P1 striolar type I hair cell as in A, evoked by ±1 μm sinusoidal bundle displacements (2–100 Hz, bottom), 36°C. Adaptation caused high-pass filtering (attenuation of the response at low frequencies). E, Representative FFT analyses of Imet (dark gray, 27°C) and probe motion (light gray) produced by ±1 μm sinusoidal bursts at 2 (left), 20 (middle), and 100 Hz (right). Higher harmonics (2f0 and 3f0) are at least 15 dB below the f0 peak. F, Bode plots of the average gain (top) and phase angle (bottom) of the fundamental (f0) component of Imet for 27 and 37°C in response to large stimuli (±0.6–1 μm). Responses are also plotted for a smaller stimulus (±0.3 μm) at 37°C. Positive phase angles at low stimulus frequencies and increasing gain with increasing frequency are attributable to adaptation of Imet. Gains and phase leads were higher for both stimulus levels at 37°C (red) than at 27°C (blue); see Table 1 for average values and n's in each condition. Gray circles, Responses of one cell (27°C) to an extended frequency range.
Figure 3.
Figure 3.
Membrane properties of immature type I hair cells introduce low-pass filtering and electrical tuning. Data shown are from the same P2 striolar type I hair cell at 27°C, except in C, which are averaged across three or six hair cells. A, RP evoked by the sinusoidal burst series of bundle displacements shows bandpass tuning, with largest peak–peak amplitudes at 10 and 20 Hz. Asterisk, Part of the 2 Hz response is expanded in A.1, revealing voltage oscillations. A.1, Cyan curve, Fit of the oscillations (Eq. 7) used to generate fe and Qe (Eq. 8) data in G and H. B, FFT analyses of RP produced by sinusoidal bursts at 2 (left), 20 (middle), and 100 Hz (right), for ±1 μm stimuli. Upper harmonics are at least 15 dB below the f0 peaks. C, Bode plots of the mean gain and phase angle of the f0 component of RP as functions of frequency for ±0.6–1 μm sinusoidal burst stimuli. Blue circles, RP averaged from six hair cells providing Imet data at 27°C (Table 1; Fig. 2D). Gray triangles, RP averaged from three hair cells over a wider frequency range (0.5–200 Hz). Low-pass filtering by the hair-cell membrane decreased the phase lead of RP relative to bundle displacement as frequency increased; it became negative (a phase lag) above 10 Hz. D–H, A.1, Electrical tuning of the hair-cell membrane contributed to RP tuning in immature striolar type I hair cells. D, RPs evoked by three step displacements of the hair bundle resonated at different frequencies and qualities: −90 nm step (black): fe = 5.6 Hz, Qe = 7.3; +100 nm step (cyan): fe = 14 Hz, Qe = 6.3; +670 nm step (gray): fe = 35 Hz, Qe = 1. E, fe and Vm had similar operating ranges of bundle displacement (X), consistent with fe depending on Vm. Both fe (cyan, left axis) and steady-state (SS) Vm (gray, right axis) were sigmoidal functions of X, saturating at ∼0.5 μm. At resting bundle position (steady-state Vm, −47 mV), fe was ∼8 Hz. Peak Vm(X) relation (black circles) had a more sloping saturation. F, Current steps evoked voltage oscillations. A +40 pA current step evoked prominent voltage oscillations (violet). Slower voltage oscillations are visible at resting potential (black). A +120 pA step evoked a faster, more damped oscillation (light gray). G, H, Voltage dependence of resonant frequency (fe) and tuning sharpness (Qe) overlapped for bundle displacements and current steps. G, fe as function of steady-state membrane potential in response to current steps (violet) or bundle steps (dark cyan triangles) or large, low-frequency sinusoidal bundle displacements (bright cyan circles; see A.1). The relation was fit with an exponential function (black curve, R2 = 0.93). H, Qe as a function of steady-state Vm. Symbols as in G. Tuning was sharpest (Qe largest) near resting potential [i.e., the smallest bundle steps (dark cyan triangles)].
Figure 4.
Figure 4.
Timing and level dependence of postsynaptic currents, potentials, and spikes recorded from striolar calyces in response to step displacements of type I hair bundles. A, EPSCs. A.1, Responses of a P6 calyx to three positive bundle displacements. Latencies from step onset to onset of first EPSC: 10 ms for the black step; 6.5 ms for the cyan and magenta steps. Latencies to first EPSC are plotted against displacement in F (cyan inverted triangles). A.2, Distributions of EPSC peak sizes from five striolar complex calyces (gray bars, 25–29°C, P4–P7); the distribution for the calyx of A.1 is superimposed (magenta, expanded count scale on right axis). B, Step-evoked RPs from striolar type I hair cells are compared with EPSCs (inverted for comparison) from striolar calyces; records were obtained independently but are matched for stimulus, postnatal age, epithelial zone, and temperature. B.1, Type I: P3, 28°C; calyx: P4, triple, 29°C. The delay of the EPSC relative to the RP (arrow) is 6 ms. EPSC decay time constant (cyan curve) is 9.6 ms. The height of the EPSC (95 pA) suggests summation of five miniature events (vesicles). B.2, P7 type I hair cell at 38°C (with low-voltage-activated conductance, gK,L; see Fig. 10); P7 double calyx at 39°C. Delay from RP to EPSC (arrow), 2.6 ms. EPSC decay time constant (cyan curve), 1.8 ms. B.3, Averaged EPSCs (inverted, 21 traces) and averaged EPSPs (17 traces) from a P7 double calyx at 27°C in response to +1 μm step deflections of a single hair bundle; compare with Imet and RP of a single type I hair cell (same hair cell as in B.1). Mean peak EPSC and EPSP values are −31 pA and 2.2 mV, corresponding to ∼1.5–2 vesicles (based on size distribution data in A). Synaptic delay from averaged RP to averaged EPSC (arrow), 4.6 ms. Monoexponential fits to the decays of the averaged EPSC and EPSP had time constants of 15.1 and 7.7 ms, respectively (fits not shown). C, Level dependence of EPSPs and spikes evoked in a double calyx by step deflections of one of its input hair bundles (P7, 27°C). C.1, As level (bundle displacement) increased (bottom traces), EPSP latency decreased and EPSP size increased until spike threshold (∼−63 mV in this calyx) was crossed (purple trace). A further increase in bundle displacement reduced spike latency (black trace). C.2–C.5, In mixed EPSP and spike responses (as in C.1), EPSPs (orange triangles) and spikes (black circles) were analyzed separately. EPSP traces that did not give rise to spikes were averaged together (n's for EPSPs for C.4 and C.5 are given in C.4 next to the data points). EPSPs at levels above spike threshold are not shown; instead, spikes are counted. C.2, Average EPSP peak size increased from 1.5 mV (∼1 quantum) at displacements < 200 nm to 3 mV (∼2 quanta) at 300 nm. All EPSPs occurred near the beginning of the step, but because of jitter in their timing (C.5), aligning the averaged traces by the onset of the displacement step reduced the peak relative to an average made by aligning quantal events (data not shown). C.3, Number of events per step. This calyx lacked spontaneous activity; EPSPs were first detected at +75 nm and increased in number per step until they started triggering spikes at +200 nm. C.4, C.5, Latency (C.4, step onset to response peak) and jitter (C.5) declined for both EPSPs and spikes as bundle displacement increased up to ∼300 nm. At higher levels, spike latency (measured at spike peak) and jitter plateaued at 7.9 and 0.7 ms, respectively. C.4, Cyan triangles, First EPSC latencies from the calyx of A.1 show a long minimum latency similar to that for spikes in the calyx featured in C.
Figure 5.
Figure 5.
Timing and tuning differ for quantal (Q) and nonquantal (NQ) transmission at calyceal synapses. Data shown are from three exemplar calyces, all in the first postnatal week and recorded at 25–29°C. A, Voltage responses from a double calyx (P5, 27°C) during step stimulation of one of the two hair bundles. A.1, Steps evoked long-lasting (tonic) voltage responses quite different from EPSPs, which are discrete and have a positively skewed shape (examples in Figs. 4B,C.1, 5C). Large stimuli triggered a single spike (black trace). A.2, Nonquantal responses in A.1 are compared, on an expanded time scale and compressed voltage scale, to quantal responses to similar step stimuli recorded in an adjacent double calyx of the same preparation. The two sets of traces are aligned horizontally, with black arrows showing step onset; vertical scaling is the same for both sets of data but vertical alignment is arbitrary. The onset of the nonquantal response (top, cyan arrow) precedes the onset of quantal responses (bottom, purple arrow) by >4 ms. Contrast the discrete EPSP in the quantal response to the sustained depolarization in the subthreshold nonquantal response (orange traces). Note also that the negative step (brown) evoked a hyperpolarizing nonquantal response (expanded in A.1) but no quantal response. B, Voltage response from the calyx of A.1 (single trace) to sinusoidal burst stimuli. From 2–10 and 80–100 Hz, nonquantal potentials were sizeable but subthreshold; at 20, 40, and 50 Hz, they evoked spikes. The nonquantal response to the negative-going phase of the sinusoid dipped below resting potential (black line). C, Different modes of transmission from two hair cells within one striolar double calyx (P4, 25°C, ±300 nm sinusoidal bursts). The two hair bundles were stimulated one at a time in sequence. Stimulating bundle 1 evoked nonquantal transmission (cyan, average of 4 traces); stimulating bundle 2 evoked conventional EPSPs from the same calyx (purple, average of 10 traces). Same voltage scale for both traces. Results were consistent as the probe placement was alternated between the two hair bundles several times. The quantal response was more tuned. Black lines show resting potential; the nonquantal response had a strong hyperpolarizing component but the quantal response did not, as expected for quantal transmission on a baseline of zero spontaneous activity. D, Bode plots of f0 components of quantal and nonquantal responses. Relative to quantal-response tuning (purple traces), nonquantal tuning for both calyces (cyan and orange symbols) was much broader and, for stimulus frequencies of >5 Hz, had less phase lag (phase angles were less negative). Included are Bode plots for postsynaptic currents from the calyx of C: EPSCs driven by bundle 2 displacements (open purple triangles) and nonquantal currents driven by bundle 1 displacements (open cyan circles). Gain plots were normalized to peak values for ease of comparison.
Figure 6.
Figure 6.
The frequency dependence of postsynaptic currents and potentials recorded from striolar calyces in response to sinusoidal displacements of type I hair bundles. All signals were evoked by ±300 nm sinusoidal burst series from 2 to 100 Hz. A, EPSCs (top, 5 traces averaged) and EPSPs (bottom, 7 traces averaged) from a P4 triple calyx at 29°C. Black lines aligned with baseline at the start of each trial illustrate the gradual shift in baseline during the trial, consistent with integration or accumulation at synaptic stages. B, FFTs of averaged EPSC and EPSP responses in A at 2, 20, and 100 Hz and ±300 nm. At 2 and 100 Hz, higher harmonics were at least 15 dB below the f0 component. At 20 Hz (best frequency for this calyx), higher harmonics were significant. C, Bode plots of gain and phase versus burst frequency for ±300 nm stimuli (see A, B). Left axis, EPSCs (f0 component, n = 4 calyces). For EPSPs (right axis, from the same calyces), we plot the f0 component of FFTs (filled circles), and peak values of EPSPs (open circles). The phase of peak values leads the phase of the f0 component (bottom). D, Gain and phase of averaged EPSCs (same data as in C) and nonquantal (NQ) current (1 calyx, from Fig. 5C), both referenced to RP data from a type I hair cell. All measurements are of the f0 component from FFT analysis of responses to the ±300 nm sinusoidal burst series. The fall-off at high frequencies of the phase lead of EPSCs referenced to RPs (gray triangles) was well fit with a simple delay term of 3 ms (magenta curve), consistent with an average synaptic delay of 3 ms.
Figure 7.
Figure 7.
Striolar calyces had low-voltage-activated K channels, transient firing patterns in response to current steps, and irregular interspike intervals. A.1, Voltage-dependent currents recorded in voltage-clamp mode from a striolar double calyx. A hyperpolarizing prepulse from the holding and resting potential of −73 mV (dashed lines) turned off a low-voltage-activated current (LV, fast decline in inward current) and activated HCN current (cyan, slow increase in inward current). Depolarizing steps activated transient Na+ current and a sustained outward current (arrowhead) carried by KLV channels and likely others. Rm, 48 MΩ; Cm, 7.7 pF. A.2, Averaged I(V) relation, taken 100 ms after step onset, for nine striolar complex calyces: six double calyces (each enveloping 2 type I cells) and three triple calyces (each enveloping 3 type I cells). The slope resistance around the average zero-current potential (−69 mV) was 56 ± 2 MΩ, a low value consistent with the expression of LV and HCN channels, which are activated at resting potential. B, Current steps evoked different firing patterns depending on epithelial location. B.1, Transient (onset) firing in a striolar complex calyx. B.2, Sustained firing in an extrastriolar simple calyx (contacting 1 type I hair cell). C, Spontaneous spike timing was consistent with in vivo data specifying how timing varies with epithelial zone. C.1, A P8 striolar “quadruple” calyx (with 4 type I hair cells) was highly irregular. C.2, P8 extrastriolar simple calyx (same as in B.2) was highly regular. To simplify comparison of spike timing, we chose data with similar mean rates: 19.5 (striolar) and 19.0 (extrastriolar) spikes/s. Right, ISI distributions: coefficient of variation: 1.28 for the irregular striolar calyx, 0.05 for the regular extrastriolar calyx.
Figure 8.
Figure 8.
Spike generation sharpened tuning and increased phase lead (reduced latency) of the afferent signal. A, B, Current-clamp records from a striolar double calyx (P7, 27°C) during sinusoidal stimulation of one hair bundle. In sequence from the top are the ±600 nm stimulus, (A.1) EPSPs averaged from three sweeps obtained without spikes from a resting potential of −71 mV, (A.2) a single trace showing spiking from the same cell (which began when the cell spontaneously depolarized to −66 mV), (A.3) 14 sequential sweeps. Strong phase-locking produced near coincidence of spikes in different sweeps. The 20 Hz sinusoidal burst evoked the most spikes. B, Two sweeps of the 20 Hz response at high temporal resolution, showing both spikes and EPSPs. As shown by arrows, spikes often precede the peaks of EPSPs (i.e., spikes phase-lead EPSPs at 20 Hz). C, Gain and phase of spikes/cycle (gray circles) and spikes/second (black circles) referenced to bundle displacement expressed in micrometers. Averaged from five calyces, including the calyx in A. The number of spikes per cycle is more analogous to the sizes of RPs, EPSCs, and EPSPs plotted in Figures 3C and 6C; the number of spikes per second can be compared with in vivo afferent data. D, Transfer functions for spikes/second referenced to EPSPs for the quantal data in C (solid black) and for the nonquantal (NQ) data in Figure 5B (open brown triangles). By comparing spike rate with EPSPs, these plots show the additional tuning at the spike-generation stage; failure to trigger spikes at outlying frequencies significantly sharpens the spike-tuning curve. Bottom, Phase difference between spikes and EPSPs (spike phase minus EPSP phase), with EPSP phase measured in two ways for the quantal data: from the f0 FFT component of EPSPs (black circles) or from the voltage peak (cyan circles; see B, arrows). Below 30 Hz, spikes had a substantial phase lead in either case, but the lead was smaller when peak EPSP was measured. For the nonquantal calyx in Figure 5B (open brown triangles), spikes held a phase lead relative to the f0 component of nonquantal postsynaptic potentials up to higher frequencies (100 Hz).
Figure 9.
Figure 9.
Summary of tuning by type I hair cells and calyces in the rat saccular epithelium (P2–P9) for ±600–1000 nm stimuli at 25–29°C. Gains are normalized by the peak response. The type I cell data summarized here were immature in that they lacked the signature conductance of mature type I cells, gK,L (Fig. 10). Tuning got progressively sharper as the signal advanced from the transduction channels to the afferent spike generator. A, Exemplar responses to sinusoidal bursts are aligned for a type I hair cell from a complex calyx (Imet and RP) and for a double calyx (EPSCs, EPSPs, and spikes); both cells were from P7 striolar zones and recorded at 27°C. From top to bottom: Sinusoidal bursts (2, 5, 10, 20, 40, 50, 80, and 100 Hz), Imet, RP, EPSCs, EPSPs, and spikes. B, Response gain and phase referenced to bundle displacement. Hair-cell data (Imet, RP) are the same averaged data shown in Figure 3C. Calyx data (EPSC, EPSP, spikes/cycle, and spikes/second) are from the exemplar calyx of A. FFTs were used to calculate gains and phases at each stage except spiking.
Figure 10.
Figure 10.
Acquisition of gK,L by striolar type I hair cells in the first postnatal week greatly broadened receptor potential tuning and reduced phase lags above 5 Hz. AC, Acquisition of gK,L with age; effects of temperature. A, Currents evoked in four type I hair cells by the same voltage protocol (bottom). At P2 (both 27 and 37°C), the step from −125 to −35 mV evoked a fast Na+ current and an outward current that activated positive to resting potential, as shown by activation curves in B. At P7–P8, type I hair cells had a K+ conductance, gK,L, which was activated at −65 mV, deactivated (arrow, P7 trace) during the step to −125 mV, and reactivated during the step to −35 mV. Colored curves are monoexponential fits to activation. Note the faster activation at 37°C. In the P8 trace (bottom), the gradual increase in inward current during the −125 mV step reflects activation of HCN channels. B, Conductance–voltage (G(V) or activation) curves generated from outward tail currents at −35 mV, as described in Materials and Methods, for the four cells in A. At P2, conductances activated positive to resting potential; at P7–P8, conductances activated negative to resting potential. See Table 3 for average parameters from Boltzmann fits to G(V) curves. C, Activation kinetics of K+ current as functions of age and temperature. τ values are from exponential fits of currents evoked by stepping from −125 to −35 mV, as shown in A. N's of averages are shown next to symbols. As activation shifted negatively with age, τK at −35 mV decreased. Increasing temperature by 10°C to 37°C also significantly reduced τK at −35 mV. D, RP from a type I cell with gK,L, P8, 37°C (10 traces averaged) in response to ±600 nm sinusoidal bursts. Compared with RP in immature type I cells to similar stimuli (Fig. 3A), RP in cells with gK,L was smaller and had a broader bandwidth (did not decrease with frequency, at least up to 100 Hz). E, Effects of gK,L and temperature on gain and phase of RP referenced to bundle displacement. Numbers of cells used for each curve are shown to the left of each gain curve. Cells with gK,L at 37°C (red) had much lower gains and greater phase leads than cells without gK,L at 27°C (dark blue circles). Gains were higher for small stimuli than for large stimuli (compare open circles and dark blue circles), as expected from the saturation of Vm(X) relations (Fig. 3E). Extending the frequency range for a cell with gK,L at 27°C (cyan triangles) revealed the large increase in low-pass corner frequency relative to cells without gK,L at 27°C (compare with open circles for same stimulus size and temperature). Bottom, Phase plots. In cells lacking gK,L (open and filled circles), RP lagged bundle displacement (phase was negative) for frequencies >10 Hz; in cells with gK,L (red and cyan triangles), RP led displacement (phase was positive) up to almost 100 Hz.

References

    1. Armand M, Minor LB. Relationship between time- and frequency-domain analyses of angular head movements in the squirrel monkey. J Comput Neurosci. 2001;11:217–239. - PubMed
    1. Art JJ, Fettiplace R. Variation of membrane properties in hair cells isolated from the turtle cochlea. J Physiol. 1987;385:207–242. - PMC - PubMed
    1. Baird RA, Desmadryl G, Fernández C, Goldberg JM. The vestibular nerve of the chinchilla. II. Relation between afferent response properties and peripheral innervation patterns in the semicircular canals. J Neurophysiol. 1988;60:182–203. - PubMed
    1. Barry PH. JPCalc, a software package for calculating liquid junction potential corrections in patch-clamp, intracellular, epithelial and bilayer measurements and for correcting junction potential measurements. J Neurosci Methods. 1994;51:107–116. - PubMed
    1. Beurg M, Nam JH, Chen Q, Fettiplace R. Calcium balance and mechanotransduction in rat cochlear hair cells. J Neurophysiol. 2010;104:18–34. - PMC - PubMed

Publication types

LinkOut - more resources