. 2013 May;87(9):4974-84.
doi: 10.1128/JVI.02524-12. Epub 2013 Feb 20.

Structure and dynamics of adeno-associated virus serotype 1 VP1-unique N-terminal domain and its role in capsid trafficking

Affiliations

Structure and dynamics of adeno-associated virus serotype 1 VP1-unique N-terminal domain and its role in capsid trafficking

Balasubramanian Venkatakrishnan et al. J Virol. 2013 May.

Abstract

The importance of the phospholipase A2 domain located within the unique N terminus of the capsid viral protein VP1 (VP1u) in parvovirus infection has been reported. This study used computational methods to characterize the VP1 sequence for adeno-associated virus (AAV) serotypes 1 to 12 and circular dichroism and electron microscopy to monitor conformational changes in the AAV1 capsid induced by temperature and the pHs encountered during trafficking through the endocytic pathway. Circular dichroism was also used to monitor conformational changes in AAV6 capsids assembled from VP2 and VP3 or VP1, VP2, and VP3 at pH 7.5. VP1u was predicted (computationally) and confirmed (in solution) to be structurally ordered. This VP domain was observed to undergo a reversible pH-induced unfolding/refolding process, a loss/gain of α-helical structure, which did not disrupt the capsid integrity and is likely facilitated by its difference in isoelectric point compared to the other VP sequences assembling the capsid. This study is the first to physically document conformational changes in the VP1u region that likely facilitate its externalization from the capsid interior during infection and establishes the order of events in the escape of the AAV capsid from the endosome en route to the nucleus.


Figures

Fig 1
Fig 1
AAV1 structure. (A) Crystal structure of AAV1 capsid VP3 monomer (PDB ID, 3NG9). The β-strands are shown in purple ribbon, the conserved α-helix A is in red, and loops between the strands are in yellow. The dotted lines show the relative positions of the 5-fold (filled pentagon), 3-fold (filled triangle), and 2-fold (filled oval) interfaces of symmetry from the center of the capsid. An eight-stranded β-barrel (with β-sheets βCHEF and βBIDG), along with βA (labeled) and α-helix A (αA), forms the core of the VP monomer structure, flanked by large loop regions. The DE and HI loops (between β-strands D and E and between H and I, respectively) as well as the first ordered N-terminal residue (218), the C-terminus, and the interior and exterior capsid surfaces are labeled. (B) Radially color-cued (from capsid center to surface, blue to green to yellow to red) surface representation of the AAV1 capsid. The white triangle depicts a viral asymmetric unit bounded by one 5-fold axis and two 3-fold axes with a 2-fold axis between them. The approximate locations of the icosahedral 2-fold (2F), 3F, and 5F axes are indicated by the black arrows. The positions of the DE and HI loops are indicated by the dashed arrows. Images in panels A and B were generated using PyMol (DeLano Scientific) and UCSF-Chimera (70), respectively.
Fig 2
Fig 2
Cartoon rendition of VP1u models generated by Robetta. (A and B) Portions of two models of the VP1/2 sequence showing the predominantly α-helical structure of VP1u (cyan and salmon) and a stretch of the random loops in the VP1/2 common region (yellow). (C) Superposition of two models (portions of which are shown in panels A and B) onto bovine pancreatic PLA2 (green) (PDB ID, 1BP2). The structures are superimposed with RMSDs of 3.3 Å and 2.8 Å, respectively. The active-site α-helix is conserved in both models. (D) Superposition of a model generated for AAV1 residues 1 to 250 onto the AAV1 VP3 crystal structure (residues 218 to 736). Helical regions are shown in cyan, and β-strand regions are shown in red ribbon. The VP regions are indicated, the Cα position of residue 219 is indicated with a purple sphere, αA is labeled, and the interior and exterior surfaces of the VP are indicated. These images were generated using PyMOL (DeLano Scientific).
Fig 3
Fig 3
PONDR-Fit plot of AAV1, AAV2, AAV5, and AAV8 VP1 sequences. The plot shows the disorder disposition (y axis) plotted against the residue number (x axis). The secondary-structure assignments (blue indicates β-strands, and green indicates αA) of the crystal structures of these viruses are shown below the x axis along with the regions designated as being variable (VRs VRI to VRIX, in red) between the AAVs. The residues within the HI loop located on the floor of the capsid surface depression surrounding the icosahedral 5-fold axis are also indicated. Common regions of intrinsic disorder (disorder disposition of >0.5) and order (<0.5) are observed for the four serotypes compared, although the degree of disorder differs in the VR regions.
Fig 4
Fig 4
Calculated pI values for AAV1 to AAV12. The histogram of the pI values for the AAV serotypes shows that different capsid sequences have different electrostatic properties. The VP1u (blue) pI values are 1 unit lower than the average pI values of VP3 (green) and the whole (net) capsid (purple). The VP1/2 common region (red) shows a variable pI among the different serotypes.
Fig 5
Fig 5
Representative CD spectra of AAV1 VLPs at different temperatures. A clear α-helical propensity can be seen for AAV1. This helical signal (proposed to be due mostly to VP1u) is lost as temperature increases: 30°C (blue), 50°C (lime green), 60°C (red), 65°C (navy blue), 70°C (orange), and 75°C (green).
Fig 6
Fig 6
Electron micrographs of the AAV1 VLPs. At the different temperatures and pHs used for the CD experiments, the capsids are still intact. Only when heated to 95°C do the capsids show complete denaturation. The images were collected at a magnification of ×50,000. RT, room temperature.
Fig 7
Fig 7
Temperature transition curves for AAV1 VLPs at different pHs based on CD signals at 208 nm. Plots are shown for pH 7.5 (dark blue), pH 6.0 (orange), pH 5.5 (yellow), and pH 4.0 (green). mdeg, millidegrees.
Fig 8
Fig 8
Representative CD spectra of AAV1 VLPs at the different pHs collected at 25°C. Plots are shown for pH 7.5 (dark blue), pH 6.0 (orange), pH 5.5 (yellow), pH 4.0 (green), and pH 4.0 to 7.5 (blue). A loss of secondary structure is seen with decrease in pH. This signal is restored when the pH 4.0 sample is transitioned back to pH 7.5.
Fig 9
Fig 9
Representative CD spectra of AAV6 VLPs and empty capsids at pH 7.5. Plots are shown for VLPs and empty capsids assembled from VP1, VP2, and VP3 (cyan and blue) and VLPs assembled from VP2 and VP3 only (red). A decrease in α-helical propensity (∼50%) is seen in the VLPs assembled from VP2 and VP3 only.
Fig 10
Fig 10
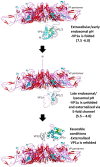
AAV VP1u externalization model. A VP pentamer containing one VP1 and 4 VP3s is shown, in which the model of VP residues 1 to 250, superposed onto the AAV1 VP3 crystal structure (1NG9) monomer, is localized directly beneath the 5-fold and 2-fold interfaces. At pH 7.5 or 6.0, the VP1u is folded. As pH is decreased to 5.5 and 4.0, unfolding is initiated and the VP1u and VP1/VP2 common region are subsequently threaded through the 5-fold pore. When the correct conditions are encountered, possibly via the lipid membrane or substrate, refolding of the partially or completely unfolded VP1u to the native functional state occurs. The PLA2 active site and Ca2+ binding residues are shown in yellow and green, respectively. The images were generated using PyMOL (DeLano Scientific).

References

    1. Atchison RW, Casto BC, Hammon WM. 1965. Adenovirus-associated defective virus particles. Science 149:754–755 - PubMed
    1. Buller RML, Janik JE, Sebring ED, Rose JA. 1981. Herpes simplex virus types 1 and 2 completely help adenovirus-associated virus replication. J. Virol. 40:241–247 - PMC - PubMed
    1. Geoffroy M-C, Salvetti A. 2005. Helper functions required for wild type and recombinant adeno-associated virus growth. Curr. Gene Ther. 5:265–271 - PubMed
    1. Walz C, Deprez A, Dupressoir T, Dürst M, Rabreau M, Schlehofer JR. 1997. Interaction of human papillomavirus type 16 and adeno-associated virus type 2 co-infecting human cervical epithelium. J. Gen. Virol. 78(Part 6):1441–1452 - PubMed
    1. Gao G, Vandenberghe LH, Alvira MR, Lu Y, Calcedo R, Zhou X, Wilson JM. 2004. Clades of adeno-associated viruses are widely disseminated in human tissues. J. Virol. 78:6381–6388 - PMC - PubMed

Publication types

Substances