

EBSeq: an empirical Bayes hierarchical model for inference in RNA-seq experiments
- PMID: 23428641
- PMCID: PMC3624807
- DOI: 10.1093/bioinformatics/btt087
EBSeq: an empirical Bayes hierarchical model for inference in RNA-seq experiments
Erratum in
- Bioinformatics. 2013 Aug 15;29(16):2073
Abstract
Motivation: Messenger RNA expression is important in normal development and differentiation, as well as in manifestation of disease. RNA-seq experiments allow for the identification of differentially expressed (DE) genes and their corresponding isoforms on a genome-wide scale. However, statistical methods are required to ensure that accurate identifications are made. A number of methods exist for identifying DE genes, but far fewer are available for identifying DE isoforms. When isoform DE is of interest, investigators often apply gene-level (count-based) methods directly to estimates of isoform counts. Doing so is not recommended. In short, estimating isoform expression is relatively straightforward for some groups of isoforms, but more challenging for others. This results in estimation uncertainty that varies across isoform groups. Count-based methods were not designed to accommodate this varying uncertainty, and consequently, application of them for isoform inference results in reduced power for some classes of isoforms and increased false discoveries for others.
Results: Taking advantage of the merits of empirical Bayesian methods, we have developed EBSeq for identifying DE isoforms in an RNA-seq experiment comparing two or more biological conditions. Results demonstrate substantially improved power and performance of EBSeq for identifying DE isoforms. EBSeq also proves to be a robust approach for identifying DE genes.
Availability and implementation: An R package containing examples and sample datasets is available at http://www.biostat.wisc.edu/kendzior/EBSEQ/.
Supplementary information: Supplementary data are available at Bioinformatics online.
Figures
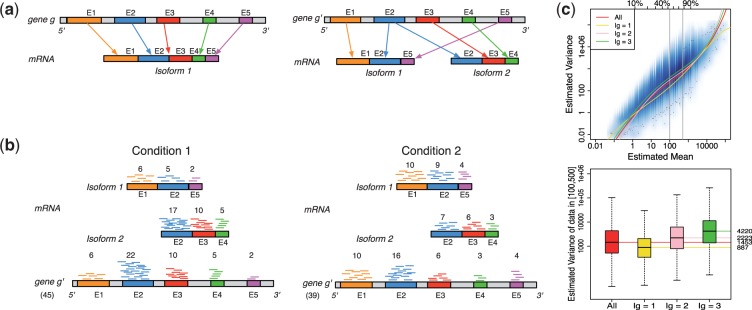
 . Gene g has one isoform, denoted by
  ; gene
  has two (
 ). The problem of estimating expression for isoforms of
  is complicated by the fact that reads mapping to exon 2 must be unambiguously assigned to each isoform. This results in increased uncertainty, on average, in expression estimates for isoforms sharing a parent. Panel (b) shows hypothetical expression of the isoforms from gene
  in each of two conditions (assuming differences in library size have been accommodated). If one focuses on the longest isoform (isoform 1) and uses all reads mapping to its constituent isoforms to estimate its expression, the isoform is called equivalently expressed, as there are 30 (6 + 22 + 2) reads mapped in condition 1 and 30 (10 + 16 + 4) mapped in condition 2. However, if the expression of other isoforms is considered, it becomes clear that isoform 1 contains almost twice as many reads in condition 2 as in condition 1 (23 versus 13, respectively). Panel (c) demonstrates how estimation uncertainty changes as isoform complexity increases. We quantified isoform complexity here by Ig where the
  group represents isoforms from genes with k isoforms (here isoforms from genes with more than three isoforms are included in the
  group; alternative definitions of complexity are discussed in the text). Shown top right are splines fit to the empirical variance as a function of the mean for all isoforms as well as isoforms within groups defined by Ig for the two-group human embryonic stem cell RNA-seq experiment described in Section 2; bottom right considers isoforms with average expression (expected count) in [100, 500]. The range was chosen as it approximates the 50th and 80th percentiles of expression across all isoforms. Shown are box plots of the variances of these isoforms collectively, and within Ig group. Median variance within each group is shown right
References
Publication types
MeSH terms
Substances
Grants and funding
LinkOut - more resources
Full Text Sources
Other Literature Sources
Medical
Molecular Biology Databases
