Review
. 2013 May;24(3):213-21.
doi: 10.1097/ICU.0b013e32835f8bf8.

Optical coherence tomography--current and future applications

Affiliations
Review

Optical coherence tomography--current and future applications

Mehreen Adhi et al. Curr Opin Ophthalmol. 2013 May.

Abstract

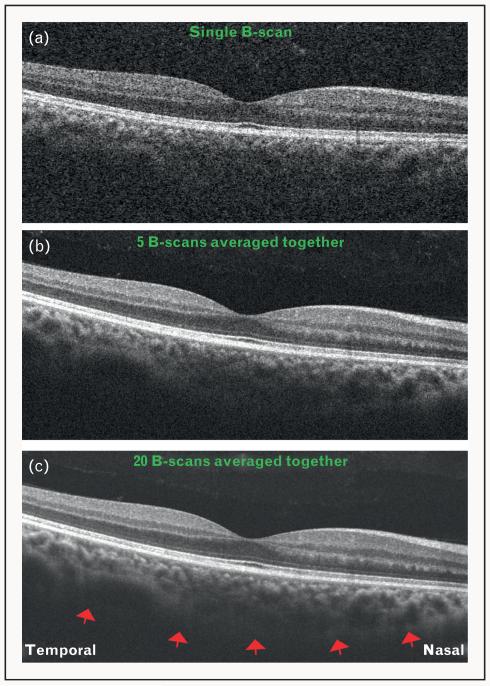
Purpose of review: Optical coherence tomography (OCT) has revolutionized the clinical practice of ophthalmology. It is a noninvasive imaging technique that provides high-resolution, cross-sectional images of the retina, retinal nerve fiber layer and the optic nerve head. This review discusses the present applications of the commercially available spectral-domain OCT (SD-OCT) systems in the diagnosis and management of retinal diseases, with particular emphasis on choroidal imaging. Future directions of OCT technology and their potential clinical uses are discussed.

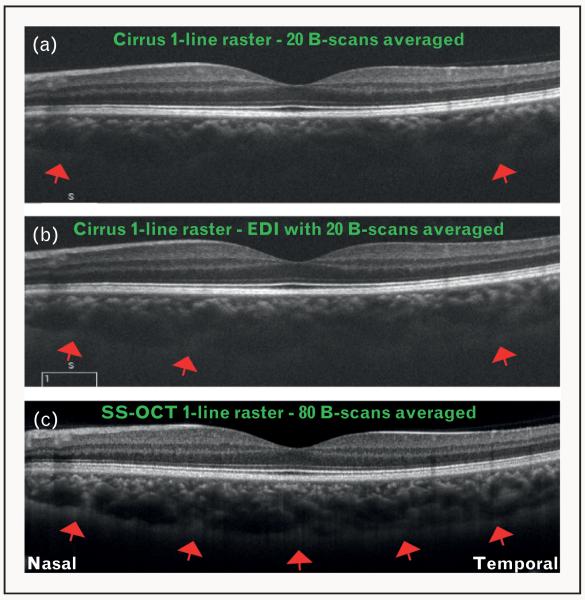
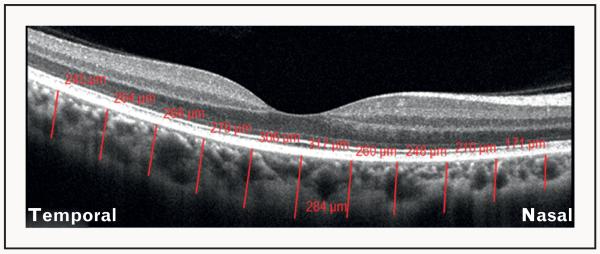
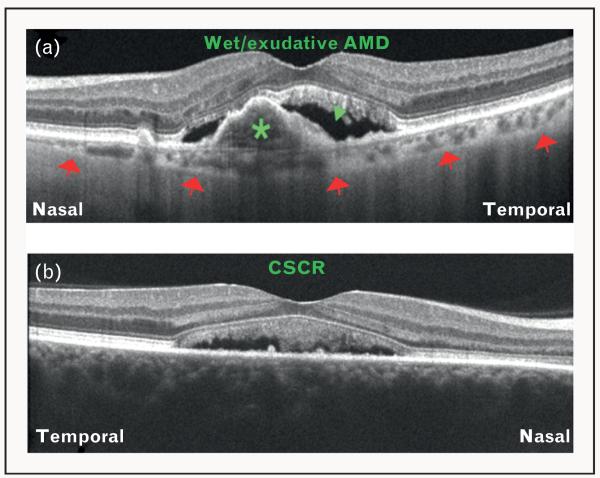
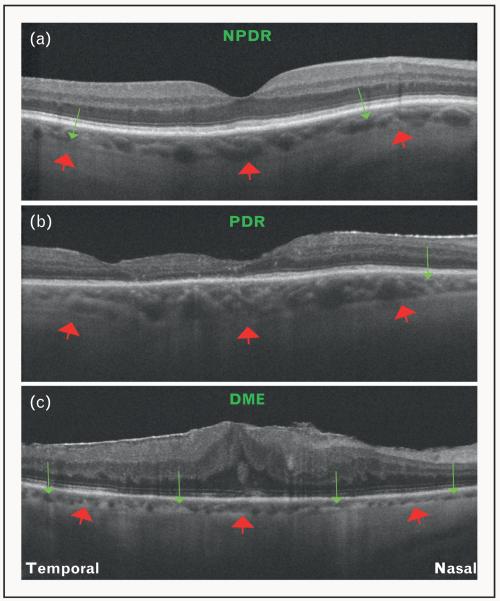
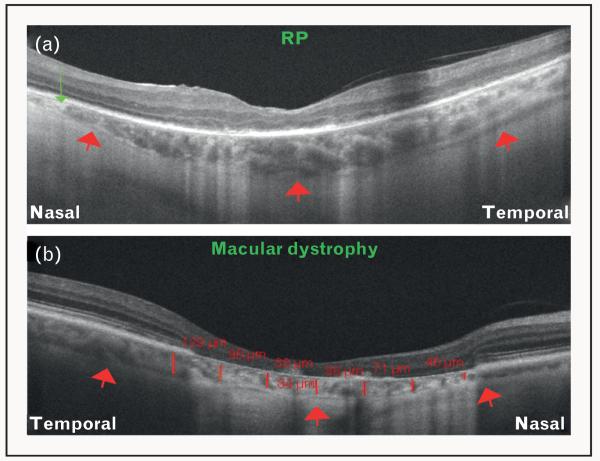
Recent findings: Analysis of the choroidal thickness in healthy eyes and disease states such as age-related macular degeneration, central serous chorioretinopathy, diabetic retinopathy and inherited retinal dystrophies has been successfully achieved using SD-OCT devices with software improvements. Future OCT innovations such as longer-wavelength OCT systems including the swept-source technology, along with Doppler OCT and en-face imaging, may improve the detection of subtle microstructural changes in chorioretinal diseases by improving imaging of the choroid.

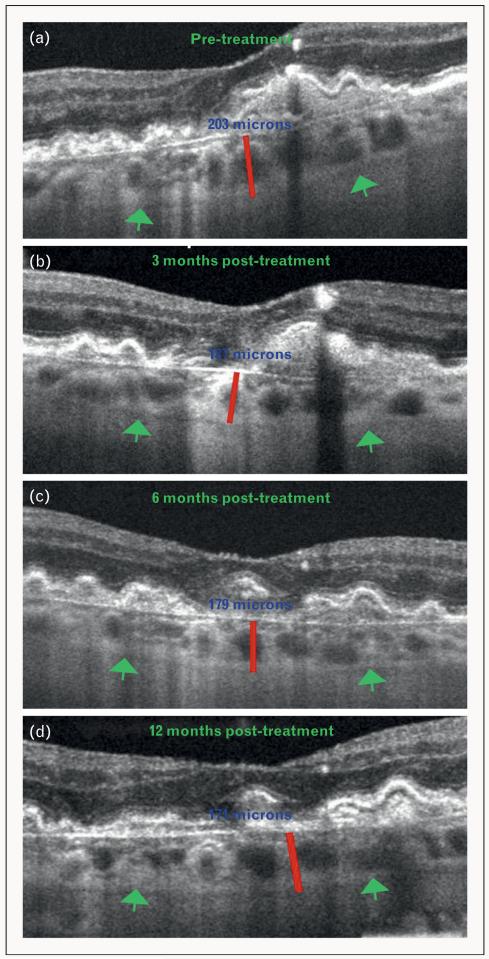
Summary: Advances in OCT technology provide for better understanding of pathogenesis, improved monitoring of progression and assistance in quantifying response to treatment modalities in diseases of the posterior segment of the eye. Further improvements in both hardware and software technologies should further advance the clinician's ability to assess and manage chorioretinal diseases.


Figures

FIGURE 1
FIGURE 1
Optical coherence tomography (OCT) images obtained using Cirrus high definition OCT (HD-OCT) system, showing increasing signal quality with the technique of image averaging. (a) A single B-scan showing low signal and increased noise. The choroid–sclera interface cannot be visualized. (b) Five B-scans averaged together to improve the signal. Note that the choroid–sclera interface is still not clearly visualized. (c) Twenty B-scans averaged together. Note the improvement in signal quality, with a fairly distinct delineation of the choroid–sclera interface (red arrows).
FIGURE 2
FIGURE 2
Optical coherence tomography (OCT) images showing increasing signal quality with the technique of enhanced depth imaging (EDI) and longer-wavelength sweeping laser light source. (a) OCT image obtained using Cirrus HD-OCT system with 20 B-scans averaged together, but without EDI. Note that choroid–sclera interface is visualized only slightly toward the far temporal and nasal aspects (red arrows). (b) OCT image obtained using Cirrus HD-OCT system with 20 B-scans averaged together and EDI. Note the improvement in the visualization of choroid–sclera interface (red arrows). (c) OCT image obtained using a swept-source OCT (SS-OCT) system centered at a wavelength of 1050 nm, and an imaging speed of 100 000 A-scans per second. Note that the signal quality is markedly improved, and the choroid–sclera interface can be visualized throughout the line scan (red arrows). Also note that within the same acquisition time (as for Cirrus HD-OCT), the SS-OCT was able to average 80 B-scans, further increasing signal quality.
FIGURE 3
FIGURE 3
Illustration of the method used for the assessment of choroidal thickness on optical coherence tomography (OCT). OCT image of a healthy eye obtained using Cirrus HD-OCT system, showing the measurement of choroidal thickness perpendicularly from the outer border of the hyperreflective retinal pigment epithelium to the inner border of the choroid-scleral interface at 11 locations: beneath the fovea, and at 500-μm intervals up to 2500-μm temporal and nasal to the fovea (red lines). The numbers in red depict the choroidal thickness measurements at each of the measured location. This was performed using the Cirrus linear measurement tool. This method is being used increasingly for the evaluation of choroidal thickness in healthy and diseased states.
FIGURE 4
FIGURE 4
Differentiation of diseases using choroidal thickness as a parameter on optical coherence tomography (OCT). (a) OCT image obtained using Cirrus HD-OCT demonstrating features of wet/exudative age-related macular degeneration (AMD) including pigment epithelial detachment (green asterisk) and subretinal fluid collection (green arrowhead). Note that the choroid is thinner than normal (red arrows = choroid–sclera interface). (b) OCT image obtained using Cirrus HD-OCT demonstrating features of central serous chorioretinopathy (CSCR). Note that the choroid is so thick that the choroid-scleral interface cannot be visualized. This is because of the loss of signal penetration and intensity at increasing depth, due to signal roll-off distal to the zero delay line.
FIGURE 5
FIGURE 5
Demonstration of choroidal thinning, following antivascular endothelial growth factor (anti-VEGF) therapy for wet/exudative age-related macular degeneration (AMD), using Cirrus HD-OCT. (a) OCT image of an eye affected with wet AMD obtained before initiation of anti-VEGF treatment. (b) OCT image of an eye affected with wet AMD obtained 3 months post anti-VEGF treatment. (c) OCT image of an eye affected with wet AMD obtained 6 months post anti-VEGF treatment. (d) OCT image of an eye affected with wet AMD obtained 12 months post anti-VEGF treatment. Green arrows indicate the choroid–sclera interface and red lines show the measurement of subfoveal choroidal thickness. Note the gradual subfoveal choroidal thinning after treatment with anti-VEGF agents (blue numbers).
FIGURE 6
FIGURE 6
Optical coherence tomography (OCT) features of diabetic retinopathy. (a) OCT image of an eye affected with nonproliferative diabetic retinopathy (NPDR) obtained using Cirrus HD-OCT. Note that the choroid is thinner than normal (red arrows = choroid–sclera interface), and focal areas of choroidal thinning can be appreciated (green arrows). (b) OCT image of an eye affected with proliferative diabetic retinopathy (PDR) obtained using Cirrus HD-OCT. Red arrows represent the choroid–sclera interface. Note an area of focal choroidal thinning (green arrow). (c) OCT image of an eye with resolving diabetic macular edema (DME), following treatment with multiple intravitreal injections, obtained using Cirrus HD-OCT. Red arrows represent the choroid–sclera interface. In contrast with NPDR and PDR, note the diffuse thinning of the choroid (green arrows).
FIGURE 7
FIGURE 7
Optical coherence tomography (OCT) features of inherited retinal dystrophies. (a) OCT image of an eye affected with retinitis pigmentosa (RP) obtained using Cirrus HD-OCT. Red arrows represent the choroid–sclera interface. Note the focal thinning of choroid nasally (green arrow). (b) OCT image of an eye affected with a macular dystrophy obtained using Cirrus HD-OCT. Red arrows represent the choroid–sclera interface. Note the significant loss of the retinal layers. Also note the significant choroidal thinning observed in this case (red lines and numbers).
FIGURE 8
FIGURE 8
Optical coherence tomography (OCT) features of an eye with choroidal osteoma. OCT image obtained using the Cirrus HD-OCT showing an irregular plate-like hyperreflectivity of the lesion (red asterisk) extending into the retina, with atrophy of the overlying retinal pigment epithelium (orange arrowheads). Subretinal fluid collection can also be observed (green arrow).

References

    1. Huang D, Swanson EA, Lin CP, et al. Optical coherence tomography. Science. 1991;254:1178–1181. - PMC - PubMed
    1. Sull AC, Vuong LN, Price LL, et al. Comparison of spectral/Fourier domain optical coherence tomography instruments for assessment of normal macular thickness. Retina. 2010;30:235–245. - PMC - PubMed
    1. de Boer JF, Cense B, Park BH, et al. Improved signal-to-noise ratio in spectral-domain compared with time-domain optical coherence tomography. Opt Lett. 2003;28:2067–2069. - PubMed
    1. Leitgeb R, Hitzenberger C, Fercher A. Performance of Fourier domain vs. time domain optical coherence tomography. Opt Express. 2003;11:889–894. - PubMed
    1. Spaide RF, Koizumi H, Pozzoni MC. Enhanced depth imaging spectral-domain optical coherence tomography. Am J Ophthalmol. 2008;146:496–500. - PubMed

Publication types

MeSH terms