. 2013 Mar 15;339(6125):1323-8.
doi: 10.1126/science.1228792. Epub 2013 Feb 21.

Stimulation of de novo pyrimidine synthesis by growth signaling through mTOR and S6K1

Affiliations

Stimulation of de novo pyrimidine synthesis by growth signaling through mTOR and S6K1

Issam Ben-Sahra et al. Science. .

Abstract

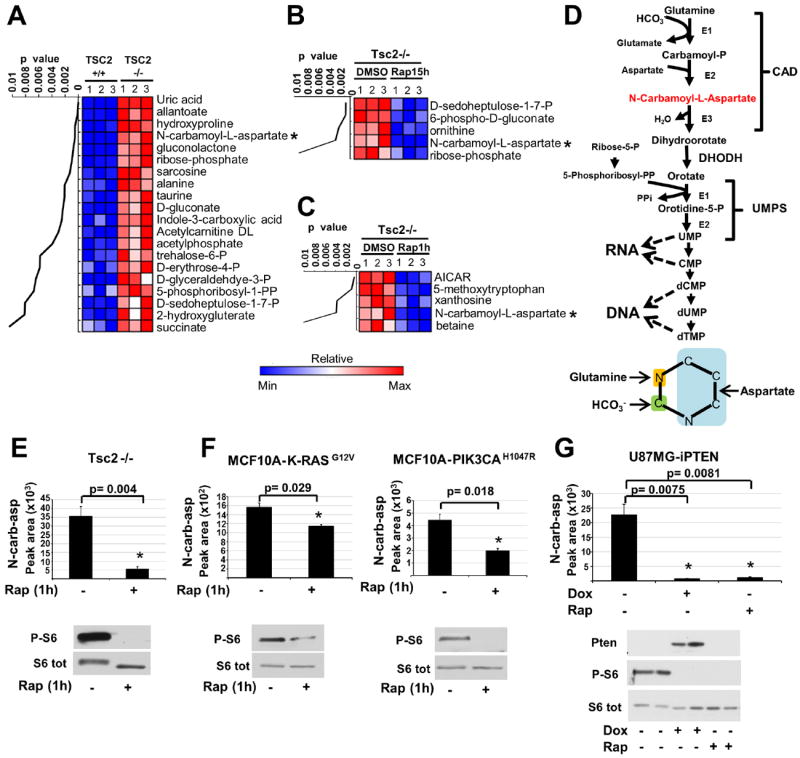
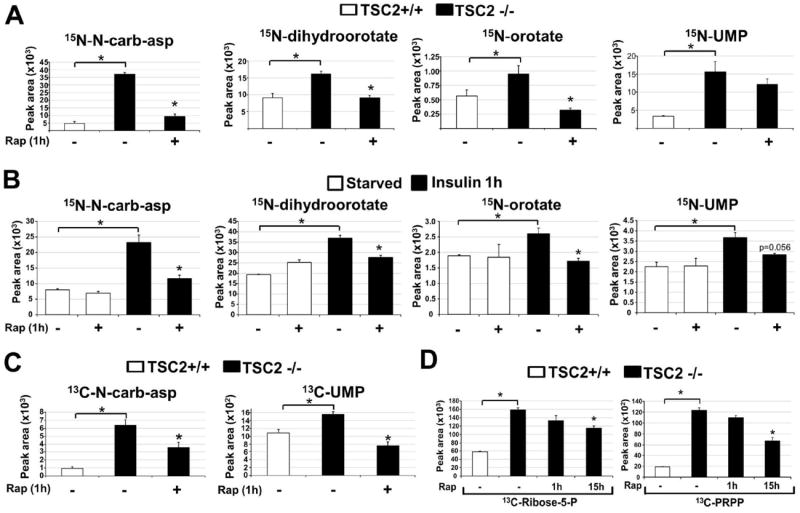
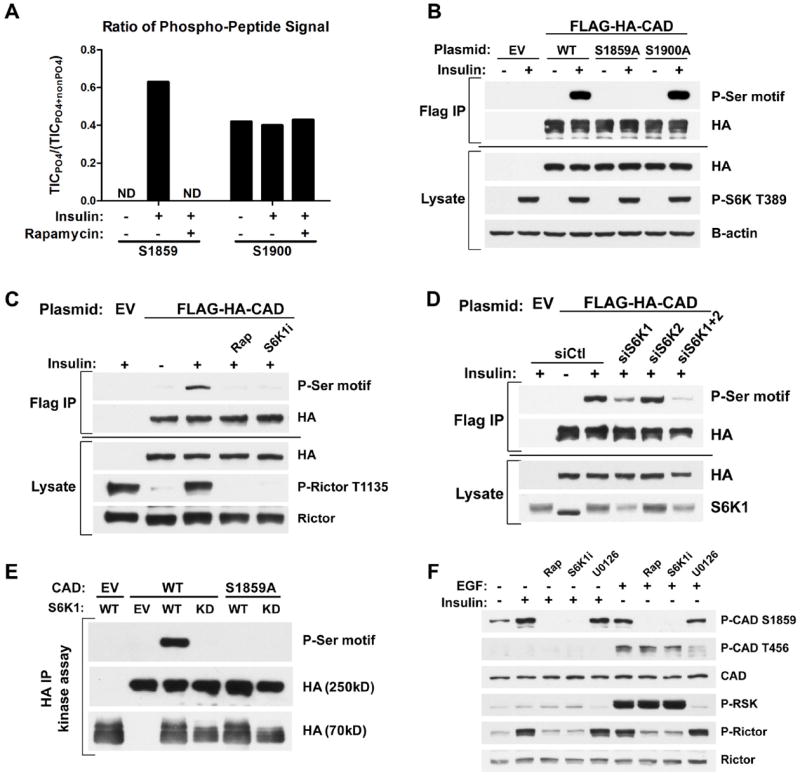
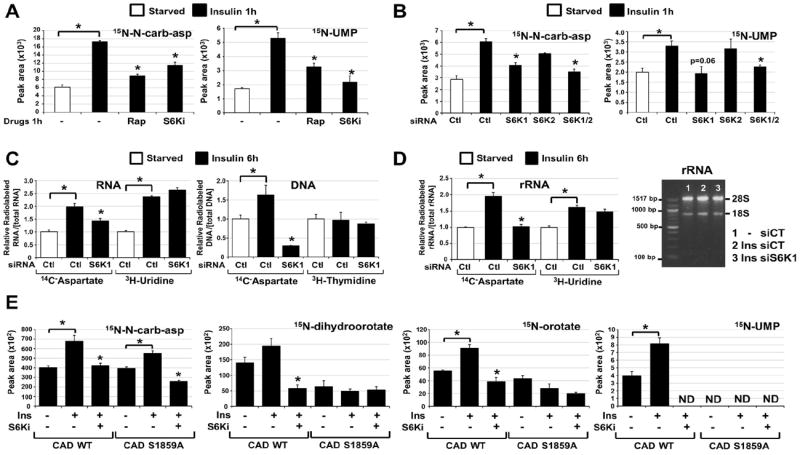
Cellular growth signals stimulate anabolic processes. The mechanistic target of rapamycin complex 1 (mTORC1) is a protein kinase that senses growth signals to regulate anabolic growth and proliferation. Activation of mTORC1 led to the acute stimulation of metabolic flux through the de novo pyrimidine synthesis pathway. mTORC1 signaling posttranslationally regulated this metabolic pathway via its downstream target ribosomal protein S6 kinase 1 (S6K1), which directly phosphorylates S1859 on CAD (carbamoyl-phosphate synthetase 2, aspartate transcarbamoylase, dihydroorotase), the enzyme that catalyzes the first three steps of de novo pyrimidine synthesis. Growth signaling through mTORC1 thus stimulates the production of new nucleotides to accommodate an increase in RNA and DNA synthesis needed for ribosome biogenesis and anabolic growth.


Conflict of interest statement

All authors have reviewed the manuscript and declare no competing financial interests.

Figures

Fig 1
Fig 1. Influence of mTORC1 on the abundance of N-carbamoyl-aspartate
(A-C) Steady-state metabolite profiles from Tsc2+/+ and Tsc2-/- MEFs grown in the absence of serum for 15 h and treated with either vehicle (DMSO) or rapamycin (20 nM). Intracellular metabolites from three independent samples per condition were profiled by LC/MS/MS, and those significantly increased in Tsc2-/- relative to Tsc2+/+ cells (A) or decreased in Tsc2-/- cells by either 15 h (B) or 1 h (C) rapamycin treatment are shown as row-normalized heat maps ranked according to p value. See table S1 for the complete metabolite profiles from these samples. (D) Schematic of the de novo pyrimidine synthesis pathway and the source of carbon and nitrogen incorporated into the pyrimidine ring (below). (E,F) The effects of mTORC1 inhibition on the steady state levels of N-carbamoyl-aspartate, measured via LC/MS/MS, in Tsc2-/- MEFs (E) or MCF10A cells stably expressing K-RasG12V or PI3KCAH1047R (F) following 15 h serum starvation and 1 h treatment with rapamycin (20 nM) or DMSO. (G) N-carbamoyl-aspartate levels were measured, as above, in U87MG cells stably expressing a doxycycline-inducible PTEN following 15 h serum starvation and treatment with doxycycline (1μg/mL) or rapamycin (20 nM) for the final 8 h. (E-G) Data are shown as the mean±SEM from triplicate samples, with immunoblots below. MetaboAnalyst and GENE-E software were used to assist metabolite data analyses. All P-values for pairwise comparisons were calculated using a two-tailed Student’s t test (N=3).
Fig 2
Fig 2. Effects of genetic or insulin-stimulated activation of mTORC1 on metabolic flux through the de novo pyrimidine synthesis pathway
(A) Normalized peak areas of 15N-labeled metabolites, measured by LC/MS/MS, extracted from Tsc2+/+ and Tsc2-/- MEFs grown in the absence of serum for 15 h, with vehicle (DMSO) or rapamycin (20 nM) treatment over the last 1 h and a 15 min pulse label of 15N-glutamine. (B) Normalized peak areas of 15N-labeled metabolites from wild-type MEFs treated as above, but stimulated with insulin (100 nM) for 1 h, where indicated. (C) Normalized peak areas of 13C-labeled metabolites from cells treated as in (A), but with a 15 min pulse label of [4-13C]-aspartate prior to metabolite extraction. (D) Normalized peak areas of singly 13C-labeled metabolites from cells treated as in (A) but with rapamycin treatment for either 1 h or 15 h and 15-min pulse label with [1,2-13C]-glucose prior to metabolite extraction. (A-D) All data are presented as mean±SEM over three independent samples per condition. *P<0.05 for pairwise comparisons calculated using a two-tailed Student’s t test (N=3), with all P-values provided in table S3.
Fig 3
Fig 3. CAD as a direct substrate of S6K1
(A) Effects of insulin and rapamycin on CAD phosphorylation sites. FLAG-HA-CAD was immunopurified from serum-starved (16 h) HEK-293E cells, treated for 1h with DMSO or rapamycin (20 nM), prior to stimulation with insulin (3 h, 50 nM). The ratios of phosphorylated to total peptide levels, measured as total ion current (TIC) by LC/MS/MS, of the indicated sites on CAD under the different conditions are graphed. ND=phospho-peptide not detected. (B) HEK-293E cells expressing empty vector (EV) or wild-type (WT), S1859A, or S1900A versions of FLAG-HA-CAD were serum-starved (16 h) and stimulated with insulin (1 h, 100 nM). FLAG-immunoprecipitates were immunoblotted with a phospho-14-3-3-binding motif antibody (P-Ser motif). (C) Cells were treated as in (B), but pretreated for 1 h with rapamycin (20 nM) or the S6K1 inhibitor PF-4708671 (10 μM, S6K1i) prior to insulin stimulation. (D) Cells were treated as in (C), but were also transfected with siRNAs targeting S6K1, S6K2, or both, or non-targeting controls (siCtl). (E) In vitro kinase assays were performed with FLAG-HA-CAD substrate (WT or S1859A) immunoprecipitated from serum-starved, rapamycin-treated HEK-293E cells and HA-S6K1 (WT or kinase dead, KD) immunoprecipitated from insulin-stimulated HEK-293E cells. (F) Hela cells were serum-starved (16 h) and pretreated for 1 h with rapamycin, S6K1i, or the MEK inhibitor U0126 (10 μM) prior to 1-h stimulation with insulin (100 nM) or EGF (20 ng/mL).
Fig 4
Fig 4. Requirement of S6K1 and S1859 on CAD for the mTORC1-dependent stimulation of the de novo pyrimidine synthesis pathway
(A) Normalized peak areas of 15N-labeled metabolites, measured by LC/MS/MS, extracted from WT MEFs serum starved (15 h) and insulin stimulated (1h, 100 nM) in presence of DMSO, rapamycin (20 nM) or PF-4708671 (10 μM, S6Ki), with a 15-min pulse label of 15N-glutamine. (B) Normalized peak areas of 15N-labeled metabolites from WT MEFs transfected with siRNAs targeting S6K1, S6K2, or both, or non-targeting controls (siCtl), were treated 48 h post-transfection as in (A). (C) The relative incorporation of radiolabel from 14C-aspartate, 3H-uridine or 3H-thymidine into RNA and DNA from WT MEFs transfected with siRNAs as in (B), serum starved (15 h), and stimulated with insulin (6 h, 100 nM), during which cells were radiolabeled. (D) The relative incorporation of radiolabel from 14C-aspartate or 3H-uridine into rRNA from WT MEFs treated as in (C). The purified rRNA was also assessed on an agarose gel (right). (E) Normalized peak areas of 15N-labeled metabolites in G9C cells expressing CAD WT or a S1859A mutant treated as in (A). ND=metabolite not detected. (A-E) All data are presented as mean±SEM over three independent samples per condition. *P<0.05 for pairwise comparisons calculated using a two-tailed Student’s t test (N=3), with all P-values provided in table S4.

Comment in

References

    1. Laplante M, Sabatini DM. mTOR signaling in growth control and disease. Cell. 2012 Apr 13;149:274. - PMC - PubMed
    1. Iadevaia V, Huo Y, Zhang Z, Foster LJ, Proud CG. Roles of the mammalian target of rapamycin, mTOR, in controlling ribosome biogenesis and protein synthesis. Biochem Soc Trans. 2012 Feb;40:168. - PubMed
    1. Porstmann T, et al. SREBP activity is regulated by mTORC1 and contributes to Akt-dependent cell growth. Cell Metab. 2008 Sep;8:224. - PMC - PubMed
    1. Duvel K, et al. Activation of a metabolic gene regulatory network downstream of mTOR complex 1. Mol Cell. 2010 Jul 30;39:171. - PMC - PubMed
    1. Huang J, Manning BD. The TSC1-TSC2 complex: a molecular switchboard controlling cell growth. Biochem J. 2008;412 - PMC - PubMed

Publication types

MeSH terms

Substances