Review
. 2013 Feb 21;5(2):396-430.
doi: 10.3390/toxins5020396.

Modulation of intestinal functions following mycotoxin ingestion: meta-analysis of published experiments in animals

Affiliations
Review

Modulation of intestinal functions following mycotoxin ingestion: meta-analysis of published experiments in animals

Bertrand Grenier et al. Toxins (Basel). .

Abstract

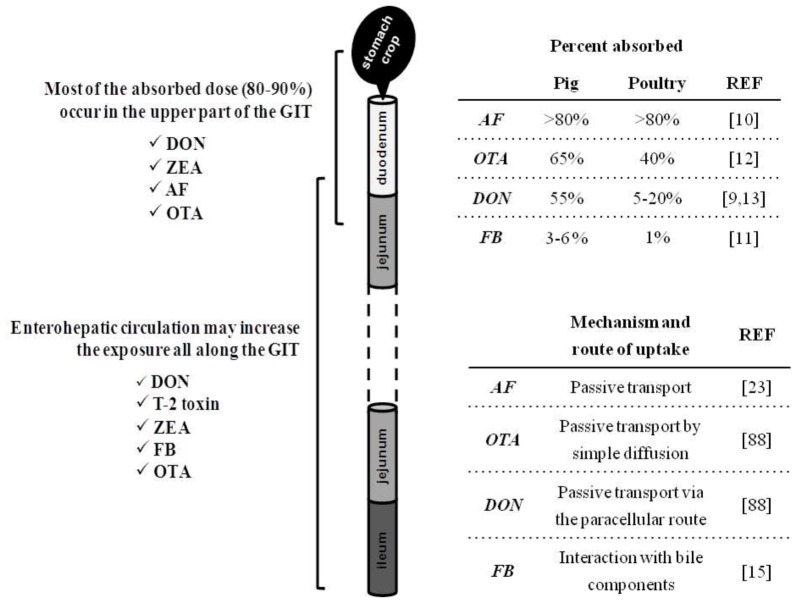
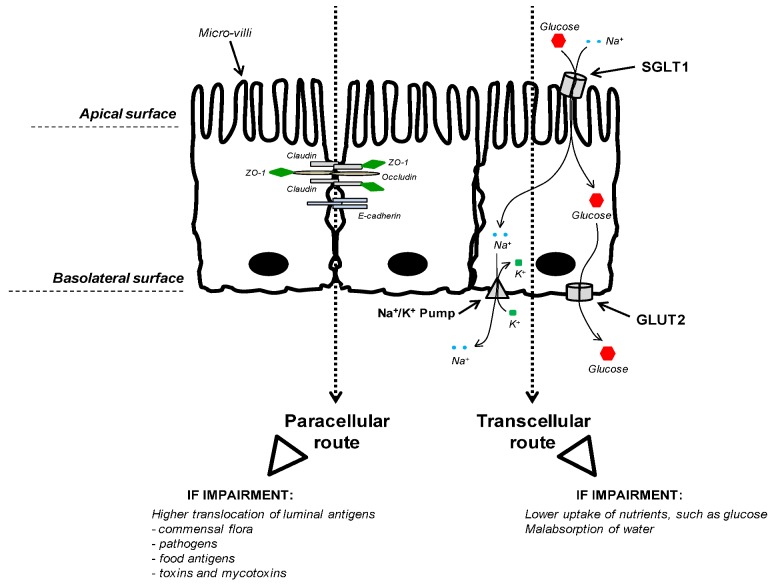
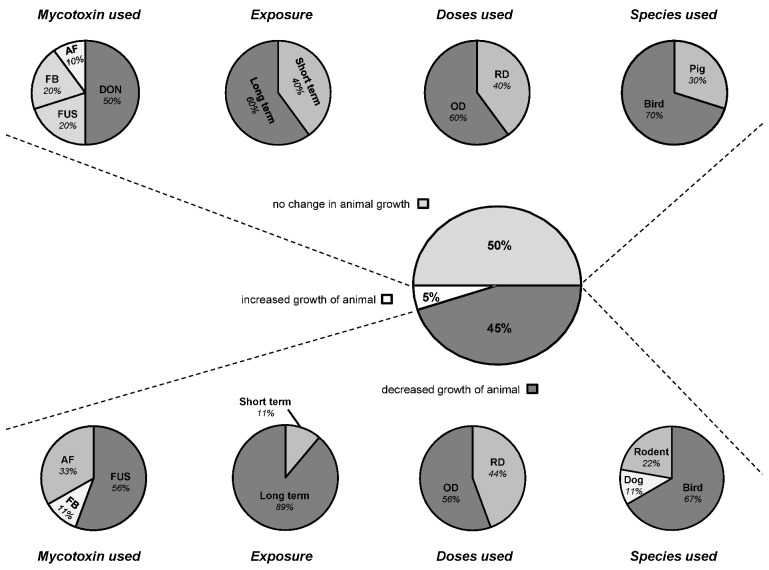
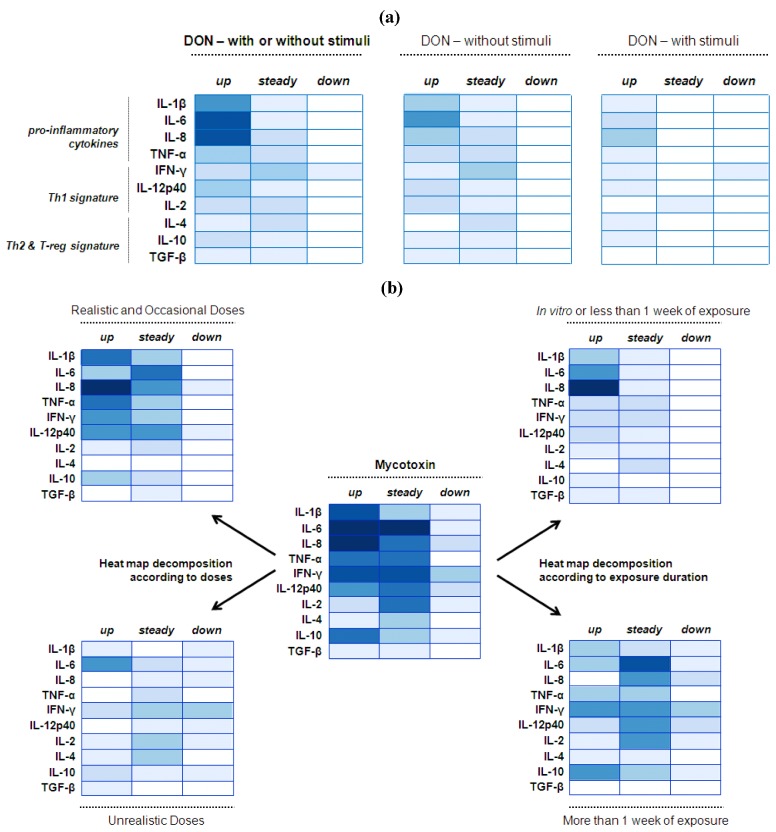
Mycotoxins are secondary metabolites of fungi that can cause serious health problems in animals, and may result in severe economic losses. Deleterious effects of these feed contaminants in animals are well documented, ranging from growth impairment, decreased resistance to pathogens, hepato- and nephrotoxicity to death. By contrast, data with regard to their impact on intestinal functions are more limited. However, intestinal cells are the first cells to be exposed to mycotoxins, and often at higher concentrations than other tissues. In addition, mycotoxins specifically target high protein turnover- and activated-cells, which are predominant in gut epithelium. Therefore, intestinal investigations have gained significant interest over the last decade, and some publications have demonstrated that mycotoxins are able to compromise several key functions of the gastrointestinal tract, including decreased surface area available for nutrient absorption, modulation of nutrient transporters, or loss of barrier function. In addition some mycotoxins facilitate persistence of intestinal pathogens and potentiate intestinal inflammation. By contrast, the effect of these fungal metabolites on the intestinal microbiota is largely unknown. This review focuses on mycotoxins which are of concern in terms of occurrence and toxicity, namely: aflatoxins, ochratoxin A and Fusarium toxins. Results from nearly 100 published experiments (in vitro, ex vivo and in vivo) were analyzed with a special attention to the doses used.


Figures

Figure 1
Figure 1
Absorption and fate of mycotoxins within the gastrointestinal tract (GIT) of non-ruminants. On the left are displayed the different segments of GIT, the sites of absorption and the dynamic of major mycotoxins within the GIT. It is a rough representation of the GIT of non-ruminants that does not take into account the size and proportion of these segments according to species. On the right is indicated the percent absorbed of major mycotoxins within the GIT of pig and poultry, and the routes of uptake of toxins.
Figure 2
Figure 2
Intestinal Epithelial Cells (IECs)—transcellular and paracellular pathways. The figure displays three enterocytes from an epithelium of the small intestine. The side of the epithelial tissue facing the lumen is the apical surface, and the surface that adjoins underlying tissue is the basolateral surface. The left side of the figure exemplifies the tight junction (TJ) complex involved in the paracellular route of absorption. TJ are the closely associated areas, at the apical side, of two cells whose membranes join together forming a paracellular barrier. It is a rough representation of the TJ complex, including only the proteins claudin, occludin and ZO-1. In addition, E-cadherin also participates to cell adhesion. The right side of the figure exemplifies the glucose transport through the transcellular route of absorption. The main apical transporter for active glucose uptake in small intestine is the sodium-dependent glucose cotransporter 1 (SGLT1). SGLT1 couples the transport of two Na+ ions and one glucose molecule to mediate unidirectionally glucose absorption from the intestinal lumen into epithelial cells. This symporter uses the electrochemical gradient of Na+ to drive the glucose absorption. The basolateral transporter GLUT2 (facilitated glucose transporter) facilitates diffusive transport of intracellular glucose into bloodstream.
Figure 3
Figure 3
Modulation of digestive and absorptive processes by mycotoxins—Consequence for animal growth. The figure displays animal body weight changes when an effect was reported on nutrient digestibility and/or nutrient uptake and/or intestinal morphology. These charts refer to 18 published articles [17,19,20,23,35,38,39,40,42,51,69,70,74,78,80,81,82,83] but reflect 20 separate studies since two articles used different concentrations of toxins within their study. The central and prominent chart refers to the overall modulation of growth balance by mycotoxins via digestive and absorptive processes. Half of these studies (10/20) did not observe changes in animal growth, 45% (9/20) observed a decrease in animal growth, and 5% (1/20) noted increased growth of the animal. According to the effect observed on animal growth, four sub-charts were established according to the cited experimental design, namely the mycotoxin used, the duration of exposure, the doses used and the species used. Short term exposure refers to trials of less than three weeks of duration, and long term to trials of more than three weeks exposure. RD, Realistic Doses; OD, Occasional Doses.
Figure 4
Figure 4
Modulation of intestinal cytokine balance induced by mycotoxins: Heat map representation. (a) Heat maps reporting DON modulation on intestinal cytokine balance; (b) Heat maps reporting mycotoxin modulation on intestinal cytokine balance. R software [94] was used to establish the heat maps. Here, this graphical representation reports the number of published studies reporting either up or steady or down regulation of certain cytokines. The values (here the number of published studies) are contained in a matrix that are represented by colors in place of numbers. The type of color used here is a spectrum of blue intensity. The more studies reporting the same effect for the same cytokine there is, the darker the cell will be. The maximum value is 7 and the minimum is 0. Example: a study reporting the up-regulation of IL-6 is numerically converted to a value of 1. Therefore, if IL-6 was shown to be up-regulated in five different studies, the value of IL-6 in the heat map would be as 5 and the blue intensity would be darker. By contrast, if IL-6 was shown only up-regulated in one study, the value in the heat map would be as 1 and the blue intensity would be lighter. Whenever authors reported an effect—up or down, or no effect—steady, on one cytokine, a value of 1 was attributed for this cytokine and categorized according to the effect noted. Figure 4a: These heat maps refer to 7 published articles [51,53,58,60,61,62,63] but reflect 10 separate studies if we consider that within the same article some authors assessed either the DON effect alone or combined with stimuli (pathogen or antigen). In line with that, the heat map on the left was therefore split in two sub-heat maps according to the exposure of the intestine to either DON alone or combined with stimuli. Among the 7 published articles, 2 studies analyzed DON effect in vitro on intestinal cell lines, 1 study analyzed DON effect ex vivo within ileal loops, and 4 studies analyzed DON effect in vivo on animals. Figure 4b: These heat maps refer to 13 published articles, the 7 previously mentioned on DON, plus 6 articles on mycotoxins other than DON [27,67,74,75,76,85]. However, some authors reported the separate effect of different mycotoxins within the same article, and/or with or without stimuli as well. Consequently, the heat maps were established according to 20 separate studies. Among the 13 published articles, 2 studies analyzed toxin effects in vitro on intestinal cell lines, 1 study analyzed toxin effect ex vivo within ileal loops, and 10 studies analyzed toxin effect in vivo on animals. Among the 13 published articles, 7 studies analyzed the effect of DON, 4 studies analyzed the effect of FB, 1 study analyzed the effect of AF, 1 study analyzed the effect of OTA, 1 study analyzed the effect of T-2 toxin, and 2 studies analyzed the effect of multi-contamination.

References

    1. Fisher M.C., Henk D.A., Briggs C.J., Brownstein J.S., Madoff L.C., McCraw S.L., Gurr S.J. Emerging fungal threats to animal, plant and ecosystem health. Nature. 2012;484:186–194. - PMC - PubMed
    1. Desjardins A., Maragos C., Norred W., Pestka J., Phillips T., Vardon P., Whitaker T., Wood G., van Egmond H. Mycotoxins:Risks in Plant, Animal, and Human System. Council for Agricultural Science and Technology; Ames, IA, USA: 2003.
    1. Bryden W.L. Mycotoxin contamination of the feed supply chain: Implications for animal productivity and feed security. Anim. Feed Sci. Tech. 2012;173:134–158. doi: 10.1016/j.anifeedsci.2011.12.014. - DOI
    1. Oswald I.P., Marin D.E., Bouhet S., Pinton P., Taranu I., Accensi F. Immunotoxicological risk of mycotoxins for domestic animals. Food Addit. Contam. 2005;22:354–360. doi: 10.1080/02652030500058320. - DOI - PubMed
    1. Lorenzoni G. Poultry Diseases Influenced by Gastrointestinal Health: Traditional Treatments and Innovative Solutions. Nottingham University Press; Loughborough, UK: 2010. Poultry Diseases Influenced by Gastrointestinal Health: Traditional Treatments and Innovative Solutions; pp. 1–140.

LinkOut - more resources