. 2013:2013:271813.
doi: 10.1155/2013/271813. Epub 2013 Jan 27.

P2X7 receptor activation induces reactive oxygen species formation and cell death in murine EOC13 microglia

Affiliations

P2X7 receptor activation induces reactive oxygen species formation and cell death in murine EOC13 microglia

Rachael Bartlett et al. Mediators Inflamm. 2013.

Abstract

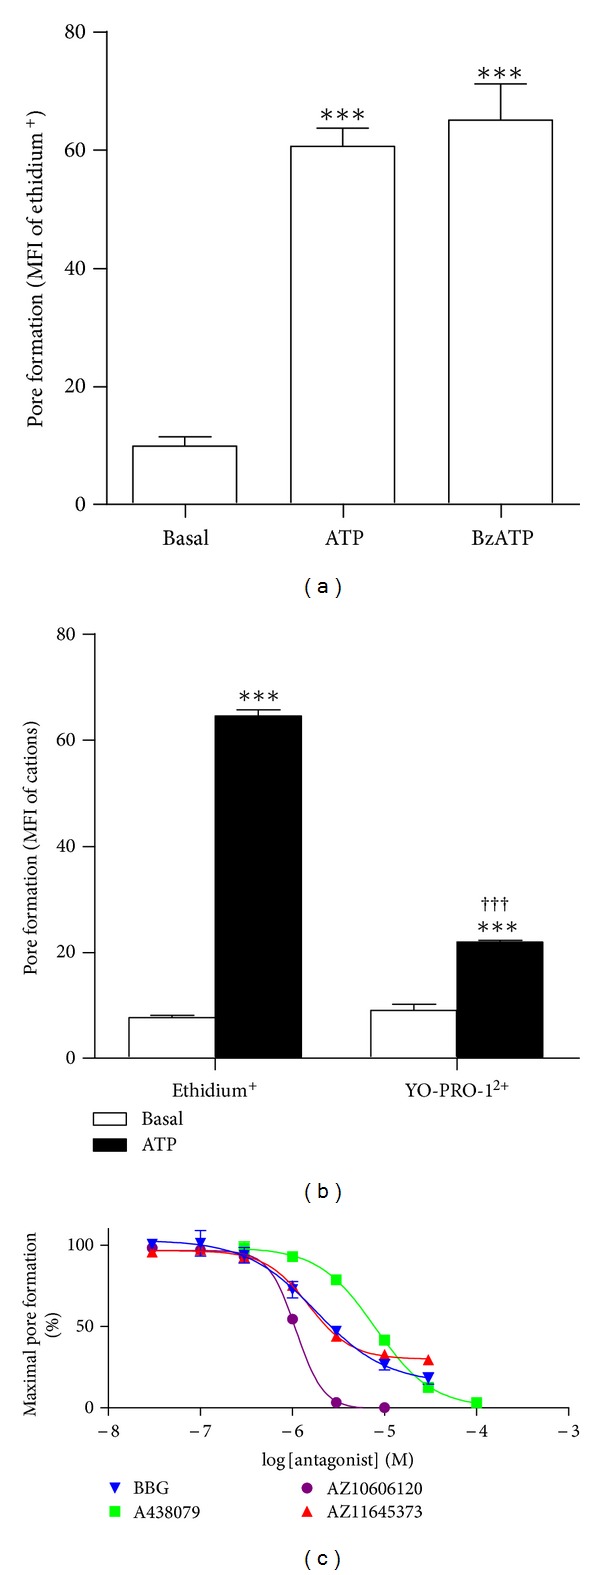
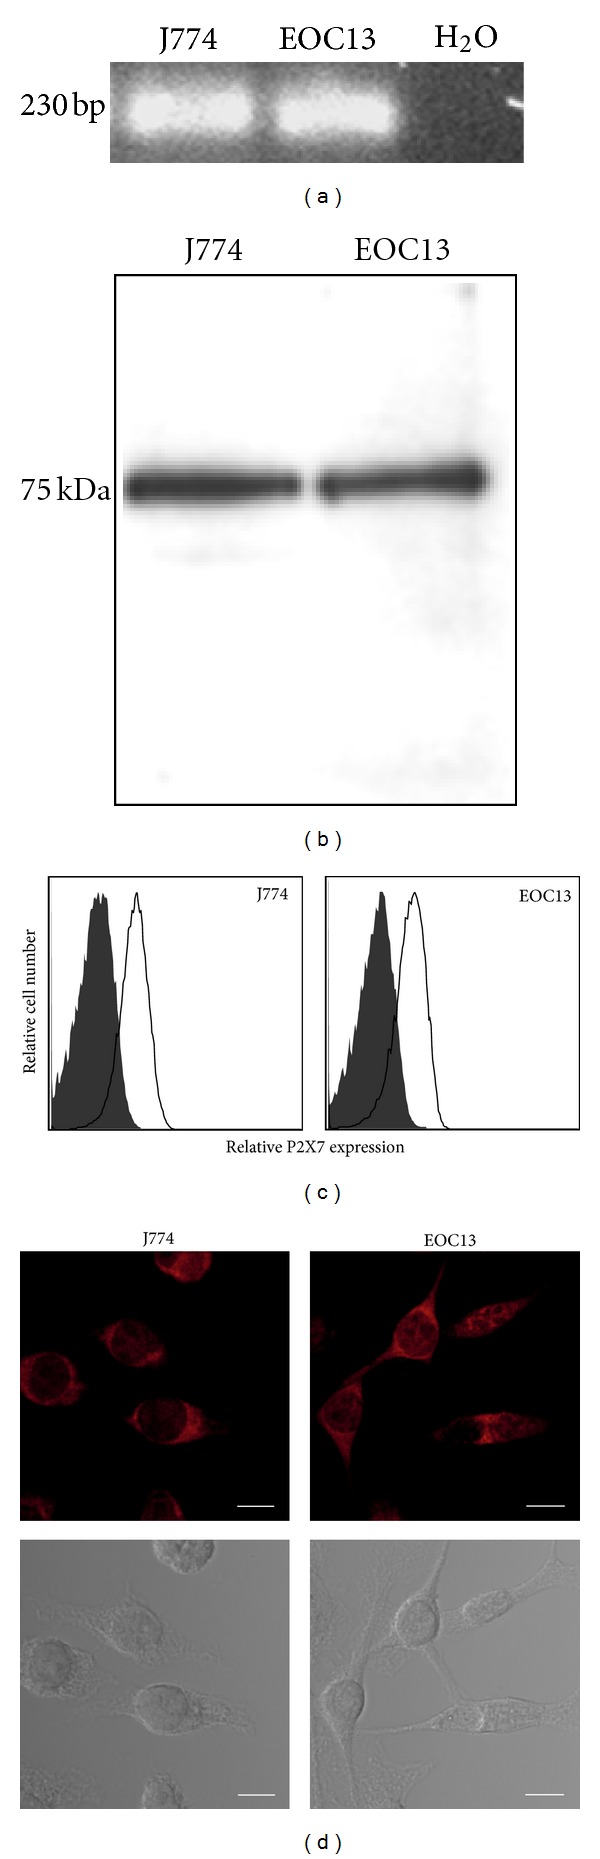
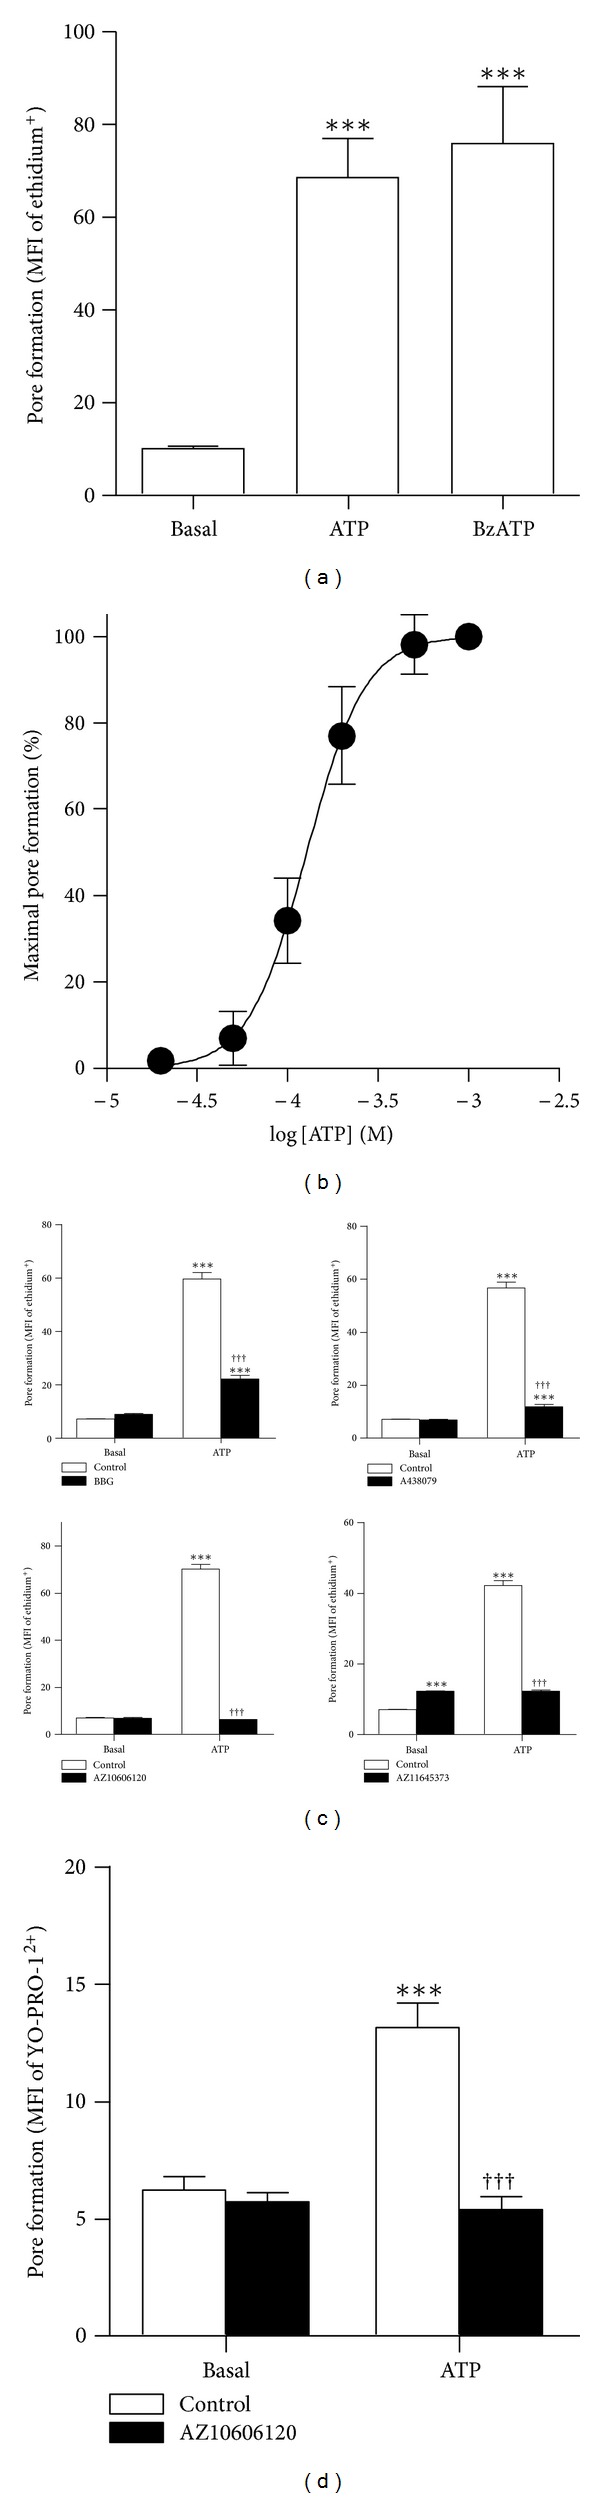
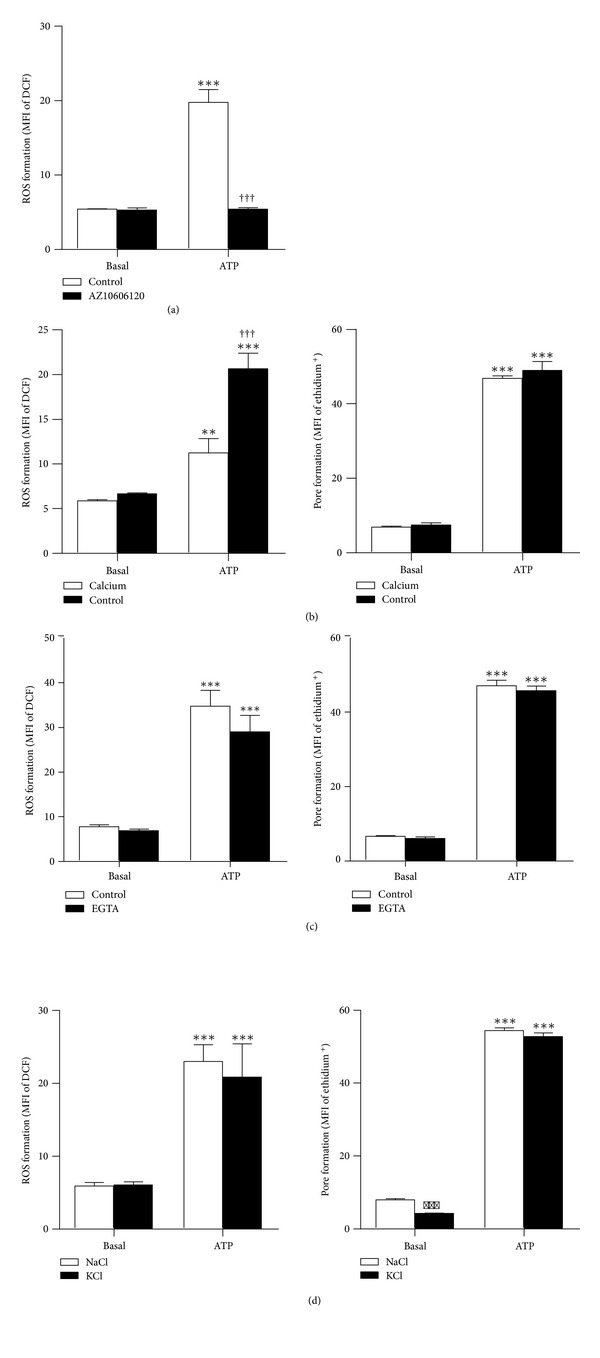
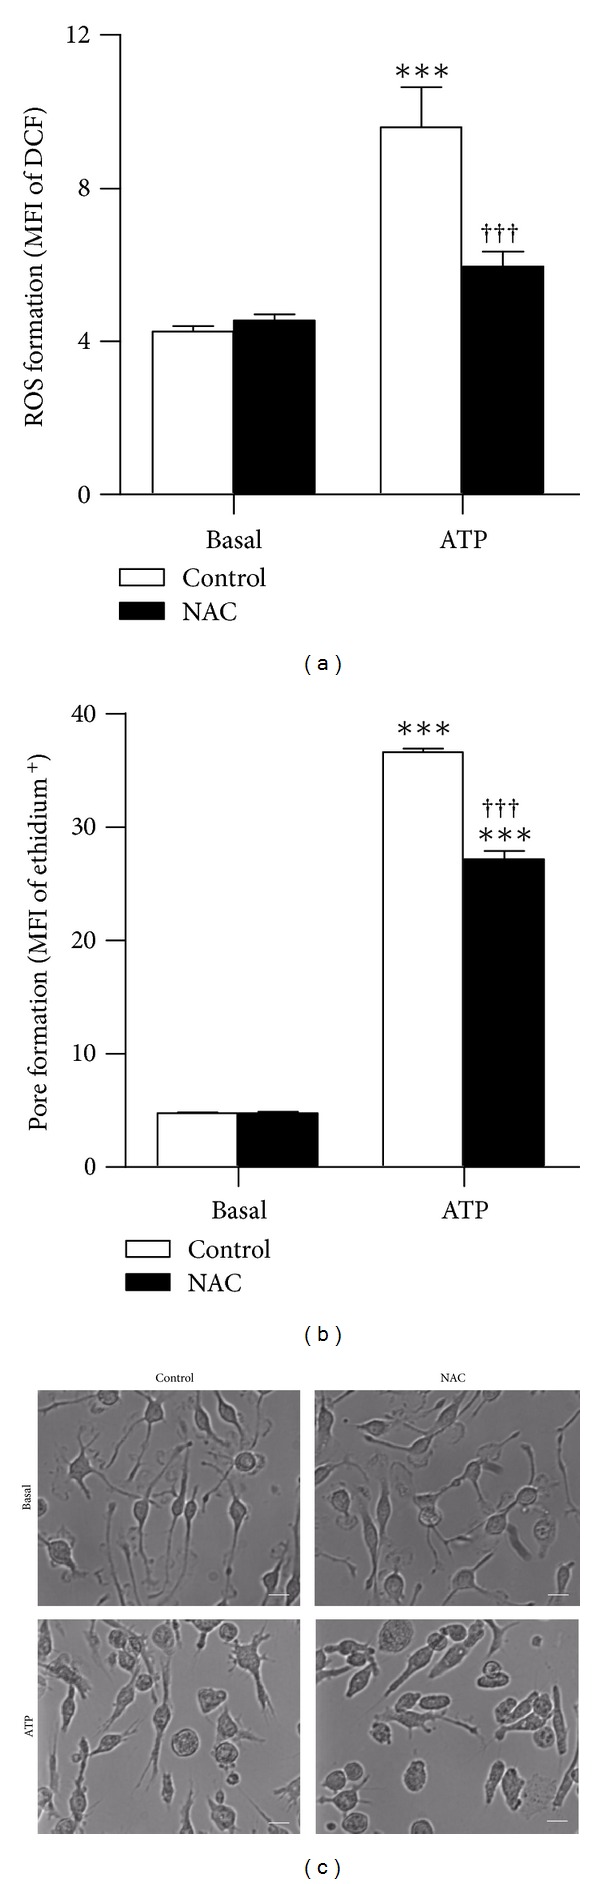
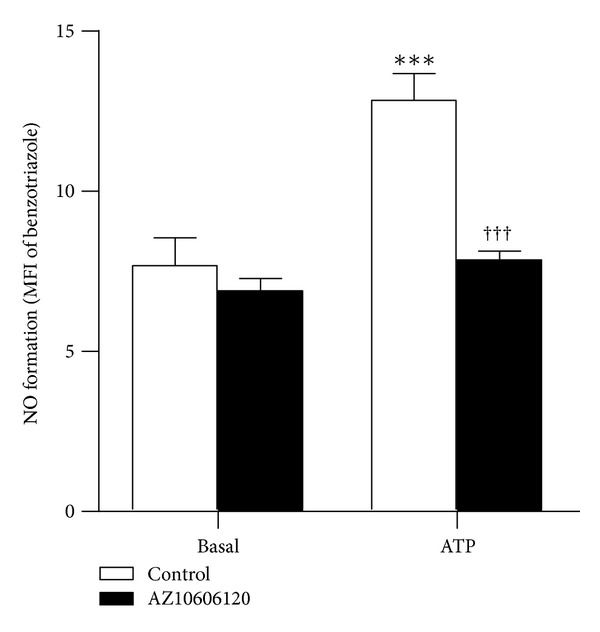
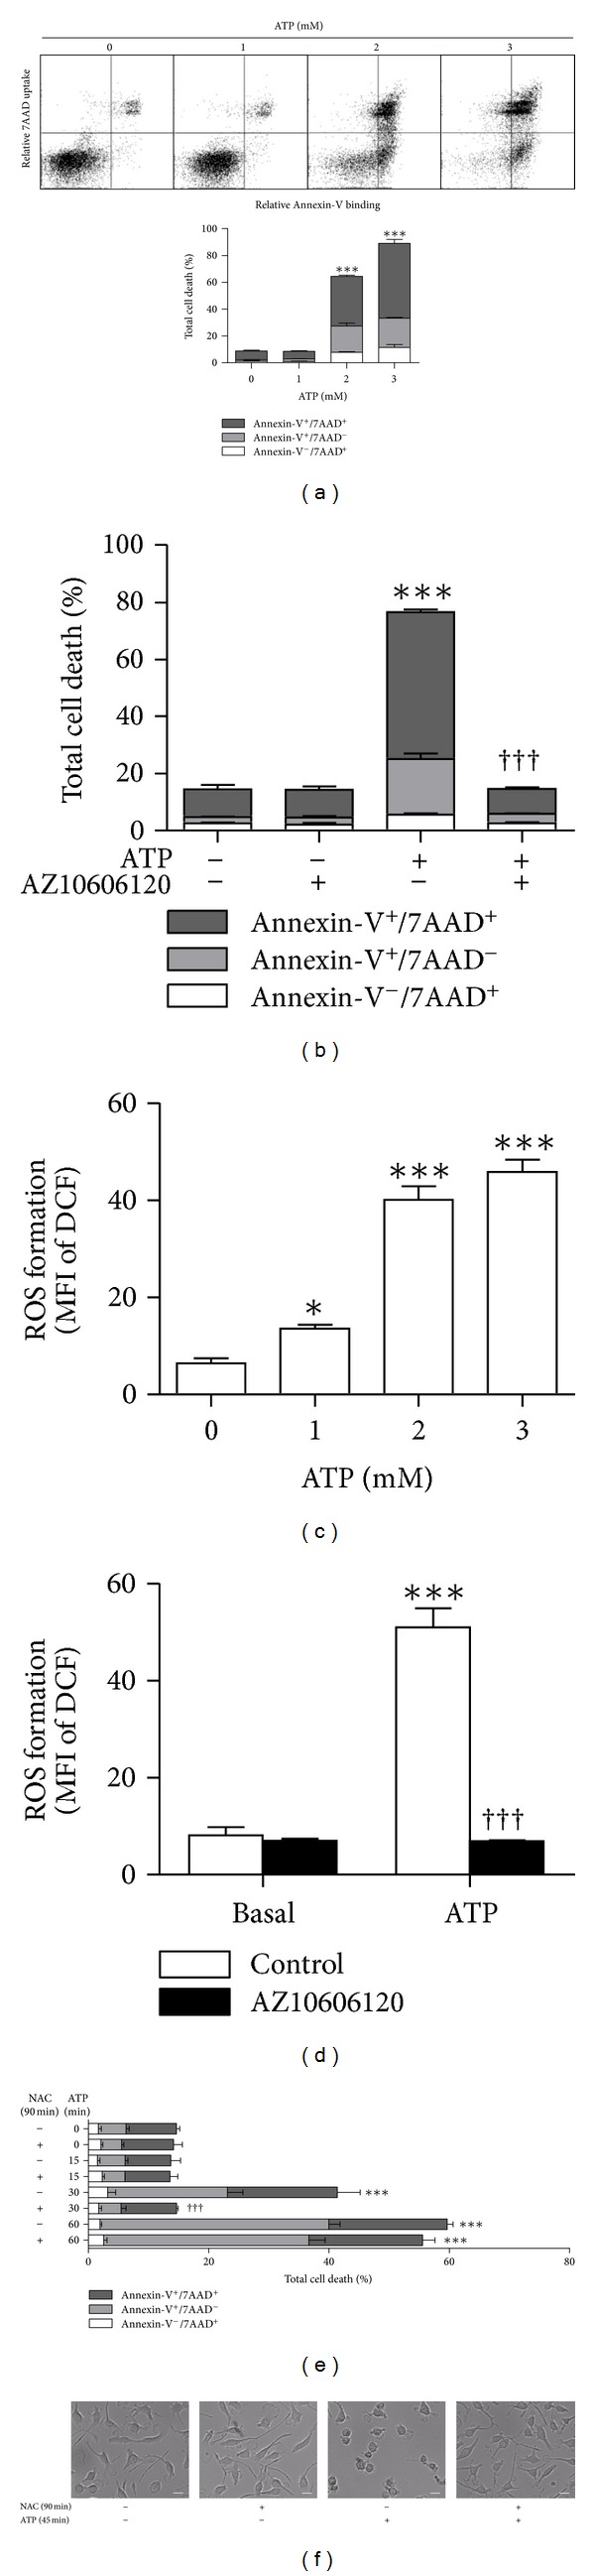
The P2X7 purinergic receptor is a ligand-gated cation channel expressed on leukocytes including microglia. This study aimed to determine if P2X7 activation induces the uptake of organic cations, reactive oxygen species (ROS) formation, and death in the murine microglial EOC13 cell line. Using the murine macrophage J774 cell line as a positive control, RT-PCR, immunoblotting, and immunolabelling established the presence of P2X7 in EOC13 cells. A cytofluorometric assay demonstrated that the P2X7 agonists adenosine-5'-triphosphate (ATP) and 2'(3')-O-(4-benzoylbenzoyl) ATP induced ethidium(+) or YO-PRO-1(2+) uptake into both cell lines. ATP induced ethidium(+) uptake into EOC13 cells in a concentration-dependent manner, with an EC(50) of ~130 μM. The P2X7 antagonists Brilliant Blue G, A438079, AZ10606120, and AZ11645373 inhibited ATP-induced cation uptake into EOC13 cells by 75-100%. A cytofluorometric assay demonstrated that P2X7 activation induced ROS formation in EOC13 cells, via a mechanism independent of Ca(2+) influx and K(+) efflux. Cytofluorometric measurements of Annexin-V binding and 7AAD uptake demonstrated that P2X7 activation induced EOC13 cell death. The ROS scavenger N-acetyl-L-cysteine impaired both P2X7-induced EOC13 ROS formation and cell death, suggesting that ROS mediate P2X7-induced EOC13 death. In conclusion, P2X7 activation induces the uptake of organic cations, ROS formation, and death in EOC13 microglia.


Figures

Figure 1
Figure 1
P2X7 antagonists inhibit ATP-induced ethidium+ uptake into J774 macrophage cells in a concentration-dependent manner. (a and b) J774 cells in NaCl medium were incubated with (a and b) 25 μM ethidium+ or (b) 1 μM YO-PRO-12+ in the absence (basal) or presence of (a and b) 1 mM ATP or (a) 0.1 mM BzATP at 37°C for 5 min. (c) Cells in NaCl medium were preincubated with Brilliant Blue G (BBG), A438079, AZ10606120, and AZ11645373 (as indicated) at 37°C for 15 min. Ethidium+ (25 μM) was then added, and cells were incubated in the absence or presence of 1 mM ATP at 37°C for 5 min. (a–c) Incubations were stopped by the addition of MgCl2 medium and centrifugation. Mean fluorescence intensity (MFI) of fluorescent cation uptake (pore formation) was determined by flow cytometry. (a and b) Results shown as means ± SD, n = 3; ***P < 0.001 compared to corresponding basal; ††† P < 0.001 compared to corresponding ATP. (c) Curves presented as a percentage of the maximal ATP-induced ethidium+ uptake and expressed as the mean ± SD, n = 3-4.
Figure 2
Figure 2
EOC13 microglial cells express P2X7. (a) RNA from EOC13 and J774 cells was amplified by RT-PCR using primers for P2X7. Water in place of RNA was included as a negative control in the PCR reaction. PCR products were separated and visualised with ethidium bromide staining. (b) EOC13 and J774 cell lysates were separated by SDS-PAGE, transferred to nitrocellulose, and probed with an anti-P2X7 Ab. (c) EOC13 and J774 cells were labelled with an anti-P2X7 (solid line) or isotype control (shaded) mAb and then with APC-conjugated anti-IgG Ab and 7AAD (to exclude dead cells). Relative P2X7 expression (mean fluorescence intensity) was determined by flow cytometry. (d) Fixed and permeabilised EOC13 and J774 cells were labelled with an anti-P2X7 Ab and then with Cy3-conjugated anti-IgG Ab. P2X7 (top panels) and phase contrast (bottom panels) images were assessed by confocal microscopy. Bars represent 10 μm. (a–d) Results are representative of 2-3 experiments.
Figure 3
Figure 3
EOC13 microglial cells express functional P2X7. (a and b) EOC13 cells in NaCl medium were incubated with 25 μM ethidium+ in the absence (basal) or presence of (a) 1 mM ATP, 0.1 mM BzATP, or (b) varying concentrations of ATP (as indicated) at 37°C for 5 min. (c and d) Cells in NaCl medium were preincubated in the absence (control) or presence of (c) 30 μM Brilliant Blue G (BBG), 100 μM A438079, 30 μM AZ11645373, or (c and d) 10 μM AZ10606120 at 37°C for 15 min. (c) Ethidium+ (25 μM) or (d) YO-PRO-12+ (1 μM) was then added, and (c and d) cells were incubated in the absence (basal) or presence of 1 mM ATP at 37°C for 5 min. (a–d) Incubations were stopped by the addition of MgCl2 medium and centrifugation. Mean fluorescence intensity (MFI) of fluorescent cation uptake (pore formation) was determined by flow cytometry. (a, c, and d) Results shown as means ± SD, n = 3; ***P < 0.001 compared to corresponding basal; ††† P < 0.001 compared to corresponding ATP in the absence of antagonist. (b) Curve presented as a percentage of the maximal ATP-induced ethidium+ uptake and expressed as the mean ± SD, n = 3.
Figure 4
Figure 4
P2X7 activation induces ROS formation in EOC13 microglial cells. (Left panels) Adherent DCF-loaded EOC13 cells or (right panels) suspended EOC13 cells in (a) NaCl medium containing 1 mM Ca2+ (preincubated in the absence (control) or presence of 10 μM AZ10606120 at 37°C for 15 min), (b) NaCl medium in the absence (control) or presence of 1 mM Ca2+, (c) NaCl medium in the absence (control) or presence of 100 μM EGTA, or (d) NaCl or KCl medium were (a–d) incubated in the absence (basal) or presence of 575 μM ATP4− (2 mM or 1.4 mM ATP as explained in Section  2.8) at 37°C for (left panels) 15 min or (right panels) 5 min in the presence of 25 μM ethidium+. (a–d) Incubations were stopped by the addition of MgCl2 medium and centrifugation. Mean fluorescence intensities (MFI) of (left panels) DCF (ROS formation) or (right panels) ethidium+ uptake (pore formation) were determined by flow cytometry and results shown as means ± SD, n = 3; ***P < 0.001 or **P < 0.01 compared to corresponding basal; ††† P < 0.001 compared to corresponding ATP.
Figure 5
Figure 5
The ROS scavenger NAC inhibits P2X7-induced ROS and pore formation in EOC13 microglial cells. (a and c) Adherent DCF-loaded EOC13 cells or (b) suspended EOC13 cells in NaCl medium were preincubated in the absence (control) or presence of 40 mM NAC at 37°C for 30 min and then in the absence (basal) or presence of 1.4 mM ATP for (a and c) 15 min or (b) 5 min in the presence of 25 μM ethidium+. (a–c) Incubations were stopped by the addition of MgCl2 medium and (a and b) centrifugation. (a and b) Mean fluorescence intensities (MFI) of (a) DCF (ROS formation) or (b) ethidium+ uptake (pore formation) were determined by flow cytometry and results shown as means ± SD, n = 3; ***P < 0.001 compared to corresponding basal; ††† P < 0.001 compared to corresponding ATP in the absence of NAC. (c) DIC images of cell morphology were acquired by microscopy. Bars represent 20 μm. Results are representative of 2 experiments.
Figure 6
Figure 6
P2X7 activation induces NO formation in EOC13 microglial cells. Adherent DAF-FM DA-loaded EOC13 cells in NaCl medium were preincubated in the absence (control) or presence of 10 μM AZ10606120 at 37°C for 15 min and then in the absence (basal) or presence of 1.4 mM ATP for 15 min. Incubations were stopped by the addition of MgCl2 medium and centrifugation. Mean fluorescence intensities (MFI) of benzotriazole (NO formation) were determined by flow cytometry and results shown as means ± SD, n = 3; ***P < 0.001 compared to corresponding basal; ††† P < 0.001 compared to corresponding ATP.
Figure 7
Figure 7
P2X7 activation induces cell death in EOC13 microglial cells. (a) Adherent EOC13 cells in complete DMEM medium were incubated in the absence or presence of varying concentrations of ATP (as indicated) at 37°C for 24 h. (b) Adherent cells in complete DMEM medium were preincubated in the absence or presence of 10 μM AZ10606120 at 37°C for 15 min and then in the absence or presence of 2 mM ATP for 24 h. (e and f) Adherent cells in complete DMEM medium were incubated in the absence or presence of 40 mM NAC at 37°C for 90 min and incubated in the absence or presence of 2 mM ATP for the final (e) 15–60 min or (f) 45 min (of the 90 min incubation), and then the medium replaced with fresh complete DMEM medium for 24 h. (a, b, and e) Cells were harvested, labelled with Annexin-V-Fluorescein and 7AAD, and the percentage of Annexin-V/7AAD+, Annexin-V+/7AAD, and Annexin-V+/7AAD+ cells (together representing total cell death) determined by flow cytometry. (f) DIC images of cell morphology were acquired by microscopy. Bars represent 20 μm. (c) Adherent DCF-loaded cells in complete DMEM medium were incubated in the absence (basal) or presence of varying concentrations of ATP (as indicated) at 37°C for 15 min. (d) Adherent DCF-loaded cells in complete DMEM medium were preincubated in the absence (control) or presence of 10 μM AZ10606120 at 37°C for 15 min and then in the absence (basal) or presence of 2 mM ATP for 15 min. (c and d) Incubations were stopped by the addition of MgCl2 medium and centrifugation. Mean fluorescence intensity (MFI) of DCF (ROS formation) was determined by flow cytometry. Results shown as (a) dot plots of one representative set of data demonstrating the quadrant markers and (a–e) means ± SD, n = 3; ***P < 0.001 or *P < 0.05 compared to (a and c) 0 mM ATP, (b and d) corresponding basal, or (e) corresponding 0 min ATP; ††† P < 0.001 compared to corresponding ATP in the absence of (b and d) AZ10606120 or (e) NAC.

References

    1. Nimmerjahn A, Kirchhoff F, Helmchen F. Neuroscience: resting microglial cells are highly dynamic surveillants of brain parenchyma in vivo . Science. 2005;308(5726):1314–1318. - PubMed
    1. Helmut K, Hanisch UK, Noda M, Verkhratsky A. Physiology of microglia. Physiological Reviews. 2011;91(2):461–553. - PubMed
    1. Hanisch UK, Kettenmann H. Microglia: active sensor and versatile effector cells in the normal and pathologic brain. Nature Neuroscience. 2007;10(11):1387–1394. - PubMed
    1. Ransohoff RM, Perry VH. Microglial physiology: unique stimuli, specialized responses. Annual Review of Immunology. 2009;27:119–145. - PubMed
    1. Block ML, Hong JS. Microglia and inflammation-mediated neurodegeneration: multiple triggers with a common mechanism. Progress in Neurobiology. 2005;76(2):77–98. - PubMed

Publication types

LinkOut - more resources