

Overexpression of initiator methionine tRNA leads to global reprogramming of tRNA expression and increased proliferation in human epithelial cells
- PMID: 23431330
- PMCID: PMC3677255
- DOI: 10.1261/rna.037507.112
Overexpression of initiator methionine tRNA leads to global reprogramming of tRNA expression and increased proliferation in human epithelial cells
Abstract
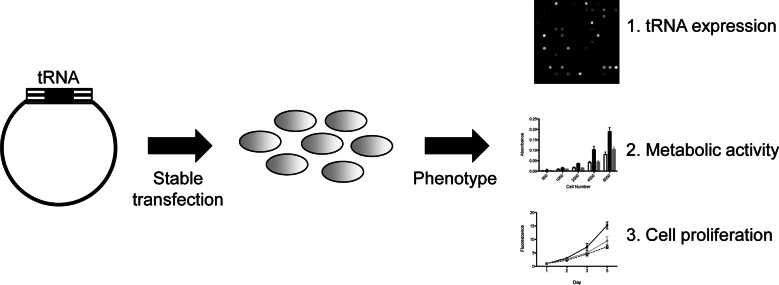
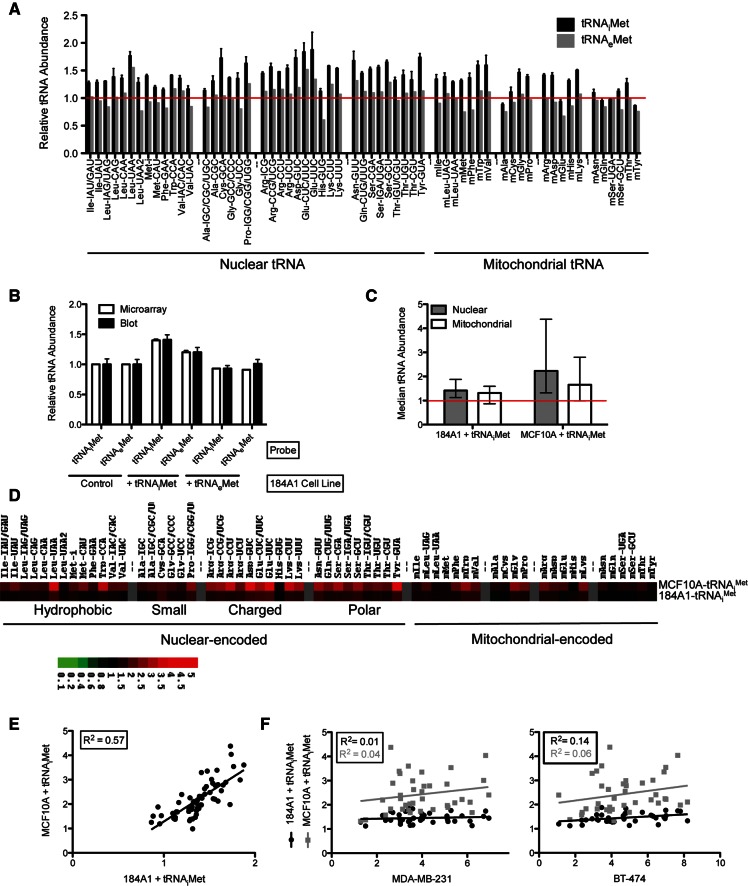
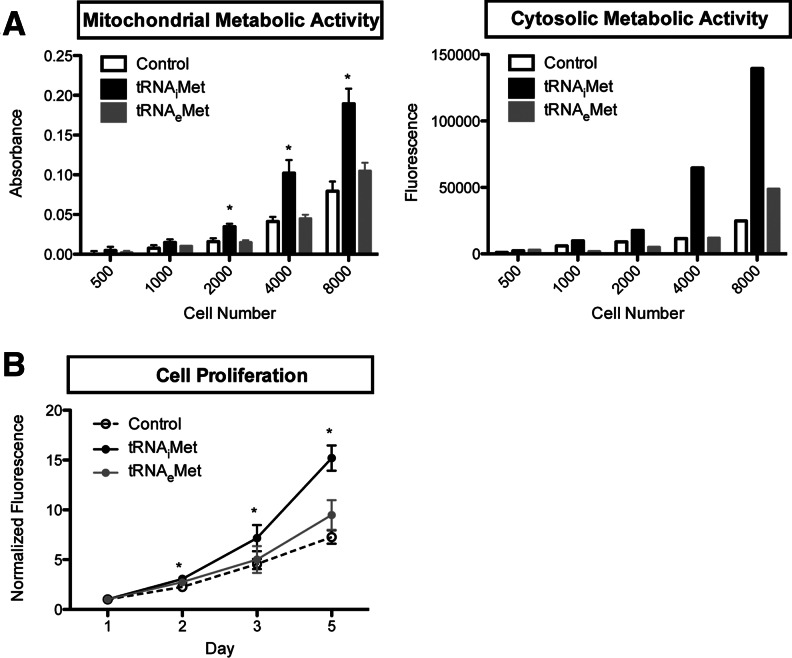
Transfer RNAs (tRNAs) are typically considered housekeeping products with little regulatory function. However, several studies over the past 10 years have linked tRNA misregulation to cancer. We have previously reported that tRNA levels are significantly elevated in breast cancer and multiple myeloma cells. To further investigate the cellular and physiological effects of tRNA overexpression, we overexpressed tRNAi(Met) in two human breast epithelial cell lines. We then determined tRNA abundance changes and performed phenotypic characterization. Overexpression of tRNAi(Met) significantly altered the global tRNA expression profile and resulted in increased cell metabolic activity and cell proliferation. Our results extend the relevance of tRNA overexpression in human cells and underscore the complexity of cellular regulation of tRNA expression.
Figures
Similar articles
-
Evolution of initiator tRNAs and selection of methionine as the initiating amino acid.RNA Biol. 2016 Sep;13(9):810-9. doi: 10.1080/15476286.2016.1195943. Epub 2016 Jun 20. RNA Biol. 2016. PMID: 27322343 Free PMC article.
-
Divergent tRNA-like element supports initiation, elongation, and termination of protein biosynthesis.Proc Natl Acad Sci U S A. 2003 Dec 23;100(26):15410-5. doi: 10.1073/pnas.2535183100. Epub 2003 Dec 12. Proc Natl Acad Sci U S A. 2003. PMID: 14673072 Free PMC article.
-
Initiator tRNA may recognize more than the initiation codon in mRNA: a model for translational initiation.Proc Natl Acad Sci U S A. 1985 Jul;82(14):4587-91. doi: 10.1073/pnas.82.14.4587. Proc Natl Acad Sci U S A. 1985. PMID: 3860810 Free PMC article.
-
Escherichia coli initiator tRNA: structure-function relationships and interactions with the translational machinery.Biochem Cell Biol. 1995 Nov-Dec;73(11-12):1023-31. doi: 10.1139/o95-109. Biochem Cell Biol. 1995. PMID: 8722017 Review.
-
Transfer RNA: a dancer between charging and mis-charging for protein biosynthesis.Sci China Life Sci. 2013 Oct;56(10):921-32. doi: 10.1007/s11427-013-4542-9. Epub 2013 Aug 27. Sci China Life Sci. 2013. PMID: 23982864 Review.
Cited by
-
Widespread association of ERα with RMRP and tRNA genes in MCF-7 cells and breast cancers.Gene. 2022 May 5;821:146280. doi: 10.1016/j.gene.2022.146280. Epub 2022 Feb 7. Gene. 2022. PMID: 35143945 Free PMC article.
-
Glycolytic flux in Saccharomyces cerevisiae is dependent on RNA polymerase III and its negative regulator Maf1.Biochem J. 2019 Apr 4;476(7):1053-1082. doi: 10.1042/BCJ20180701. Biochem J. 2019. PMID: 30885983 Free PMC article.
-
Gene-Specific Control of tRNA Expression by RNA Polymerase II.Mol Cell. 2020 May 21;78(4):765-778.e7. doi: 10.1016/j.molcel.2020.03.023. Epub 2020 Apr 15. Mol Cell. 2020. PMID: 32298650 Free PMC article.
-
Interaction of tRNA with MEK2 in pancreatic cancer cells.Sci Rep. 2016 Jun 15;6:28260. doi: 10.1038/srep28260. Sci Rep. 2016. PMID: 27301426 Free PMC article.
-
The POLR3G Subunit of Human RNA Polymerase III Regulates Tumorigenesis and Metastasis in Triple-Negative Breast Cancer.Cancers (Basel). 2022 Nov 22;14(23):5732. doi: 10.3390/cancers14235732. Cancers (Basel). 2022. PMID: 36497214 Free PMC article.
References
-
- Agris PF, Vendeix FA, Graham WD 2007. tRNA’s wobble decoding of the genome: 40 years of modification. J Mol Biol 366: 1–13 - PubMed
-
- Alexandrov A, Chernyakov I, Gu W, Hiley SL, Hughes TR, Grayhack EJ, Phizicky EM 2006. Rapid tRNA decay can result from lack of nonessential modifications. Mol Cell 21: 87–96 - PubMed
-
- Bjornsti MA, Houghton PJ 2004. Lost in translation: Dysregulation of cap-dependent translation and cancer. Cancer Cell 5: 519–523 - PubMed
-
- Borel F, Hartlein M, Leberman R 1993. In vivo overexpression and purification of Escherichia coli tRNAser. FEBS Lett 324: 162–166 - PubMed
Publication types
MeSH terms
Substances
Grants and funding
LinkOut - more resources
Full Text Sources
Other Literature Sources
Medical
Miscellaneous