. 2013;8(2):e56501.
doi: 10.1371/journal.pone.0056501. Epub 2013 Feb 19.

Morphological and metabolic changes in the nigro-striatal pathway of synthetic proteasome inhibitor (PSI)-treated rats: a MRI and MRS study

Affiliations

Morphological and metabolic changes in the nigro-striatal pathway of synthetic proteasome inhibitor (PSI)-treated rats: a MRI and MRS study

Stefano Delli Pizzi et al. PLoS One. 2013.

Abstract

Systemic administration of a Synthetic Proteasome Inhibitor (PSI) in rats has been described as able to provide a model of Parkinson's disease (PD), characterized by behavioral and biochemical modifications, including loss of dopaminergic neurons in the substantia nigra (SN), as assessed by post-mortem studies. With the present study we aimed to assess in-vivo by Magnetic Resonance (MR) possible morphological and metabolic changes in the nigro-striatal pathway of PSI-treated rats. 10 animals were subcutaneously injected with PSI 6.0 mg/kg dissolved in DMSO 100%. Injections were made thrice weekly over the course of two weeks. 5 more animals injected with DMSO 100% with the same protocol served as controls. The animals underwent MR sessions before and at four weeks after the end of treatment with either PSI or vehicle. MR Imaging was performed to measure SN volume and Proton MR Spectroscopy ((1)H-MRS) was performed to measure metabolites changes at the striatum. Animals were also assessed for motor function at baseline and at 4 and 6 weeks after treatment. Dopamine and dopamine metabolite levels were measured in the striata at 6 weeks after treatment. PSI-treated animals showed volumetric reduction of the SN (p<0.02) at 4 weeks after treatment as compared to baseline. Immunofluorescence analysis confirmed MRI changes in SN showing a reduction of tyrosine hydroxylase expression as compared to neuron-specific enolase expression. A reduction of N-acetyl-aspartate/total creatine ratio (p = 0.05) and an increase of glutamate-glutamine-γ amminobutirrate/total creatine were found at spectroscopy (p = 0.03). At 6 weeks after treatment, PSI-treated rats also showed motor dysfunction compared to baseline (p = 0.02), accompanied by dopamine level reduction in the striatum (p = 0.02). Treatment with PSI produced morphological and metabolic modifications of the nigro-striatal pathway, accompanied by motor dysfunction. MR demonstrated to be a powerful mean to assess in-vivo the nigro-striatal pathway morphology and metabolism in the PSI-based PD animal model.


Conflict of interest statement

Competing Interests: The authors have declared that no competing interests exist.

Figures

Figure 1
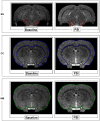
Figure 1. Coronal images of brain areas of a representative PSI-treated animal by using T2*-weighted gradient-echo sequences.
Top panel shows substantia nigra area (SN, delimited by the red frame) before (left) and after (right) PSI treatment. Notice the rim of low T2* signal intensity which characterizes the external margin of SN. Middle panel shows cerebral cortex area (CC, delimited by the blue frame) before (left) and after (right) PSI treatment. Bottom panel shows whole brain area (WB, delimited by the green rim) before (left) and after (right) PSI treatment. CC and WB areas were drawn on a coronal slice passing through the nucleus striatum.
Figure 2
Figure 2. 1H-MRS voxel on the nucleus striatum.
Coronal and axial T2-weighted Turbo Spin Echo (T2-TSE) images of the rat brain showing a 5×5×5 mm3 1H-Magnetic Resonance Spectroscopy (1H-MRS) voxel (delimited by the white perimeter) centered on the nucleus striatum.
Figure 3
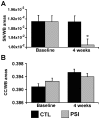
Figure 3. SN/WB and CC/WB areas modifications after PSI treatments.
Bar graphs represent the size changes of the brain areas of interest. Panel A shows group mean ± standard error of the values of SN/WB areas before and after PSI (grey bars, n = 10) and DMSO (black bars, n = 5) treatments. Panel B shows group mean ± standard error of the values of CC/WB areas before and after PSI (grey bars, n = 10) and DMSO (black bars, n = 5) treatments. The significance level was set at p<0.05 and marked with a star.
Figure 4
Figure 4. Representative 1H-MRS spectra acquired before and after treatments.
Point-resolved spectroscopy (PRESS) sequences with CHESS water suppression were performed at an echo time (TE) of 144 ms to detect the contributions of N-acetyl aspartate (NAA), total creatine (tCr) total choline (tCho), Glx (which describes glutamine (Gln) and glutamate (Glu) contributions). The acquisition duration for each spectra was 12 min. Left panel shows results in a representative vehicle-treated animal at baseline and at 4 weeks after treatment. Right panel shows results in a representative PSI-treated animal at baseline and at 4 weeks after treatment.
Figure 5
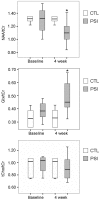
Figure 5. 1H-MRS metabolite levels modifications in the nucleus striatum of treated animals.
Box and Whiskers plot describes the distribution of the metabolites of interest quantified with in vivo 1H-MRS in the nucleus striatum of the studied animals and expressed as metabolite/tCr. Results from control animals are represented as white box (CTL, n = 5), results from PSI-treated animals are represented as grey box (PSI, n = 10). The bottom and top of the box show respectively the lower and upper quartiles; the bold band is the median; the ends of the whiskers show the minimum and the maximum value. Significant difference (p<0.05) is marked with a star. NAA = N-acetyl aspartate, tCr = total creatine, tCho = total choline, Glx = Gln (glutamine) and Glu (glutamate) contributions.
Figure 6
Figure 6. Motor performance assessment in treated animals.
Panel A shows time (s) spent immobile at Tail suspension test in PSI-treated rats at 4 weeks (p = 0.03) and at 6 weeks (p = 0.02) as compared to baseline (grey bars). No change in motor performance was found in control animals (black bars). Panel B shows decreased DA levels (ng/g) in the nucleus striatum of PSI-treated rats at 6 weeks after initial injection (p = 0.02) (grey bars) as compared to controls (black bars).
Figure 7
Figure 7. Immunofluorescence analysis.
Panel A: Representative images of samples from control (CTL) and PSI (PSI) treated rats. Note the reduction of TH positive cells in PSI treated samples. Panel B: Data deriving from quantitative analysis of TH- and NSE-positive areas are expressed as ratio TH/NSE (p = 0.006).

References

    1. Dauer W (2003) Przedborski (2003) Parkinson’s disease: mechanisms and models. Neuron 39: 889–909. - PubMed
    1. McNaught KS, Perl DP, Brownell AL, Olanow CW (2004) Systemic exposure to proteasome inhibitors causes a progressive model of Parkinson’s disease. Ann Neurol 56: 149–162. - PubMed
    1. Chu Y, Dodiya H, Aebischer P, Olanow CW, Kordower JH (2009) Alterations in lysosomal and proteasomal markers in Parkinson’s disease: relationship to alpha-synuclein inclusions. Neurobiol Dis 35: 385–398. - PubMed
    1. Stefanova N, Kaufmann WA, Humpel C, Poewe W, Wenning GK (2012) Systemic proteasome inhibition triggers neurodegeneration in a transgenic mouse model expressing human α-synuclein under oligodendrocyte promoter: implications for multiple system atrophy. Acta Neuropathol 124 51–65. - PMC - PubMed
    1. Schapira AH, Cleeter MW, Muddle JR, Workman JM, Cooper JM, et al. (2006) Proteasomal inhibition causes loss of nigral tyrosine hydroxylase neurons. Ann Neurol 60: 253–255. - PubMed

Publication types

MeSH terms

Substances

LinkOut - more resources