. 2013;8(2):e57117.
doi: 10.1371/journal.pone.0057117. Epub 2013 Feb 19.

Variability of microcirculation detected by blood pulsation imaging

Affiliations

Variability of microcirculation detected by blood pulsation imaging

Alexei A Kamshilin et al. PLoS One. 2013.

Abstract

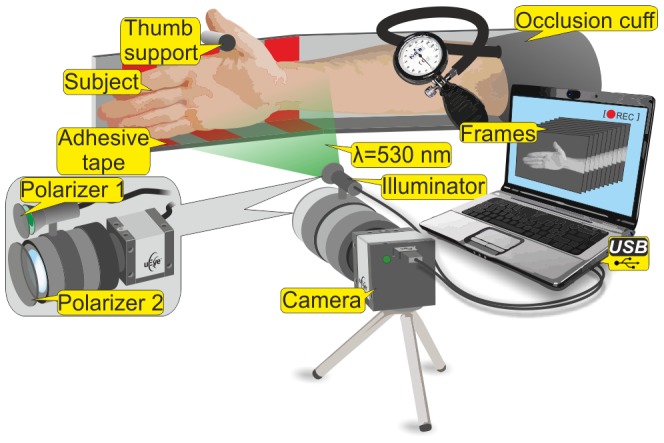
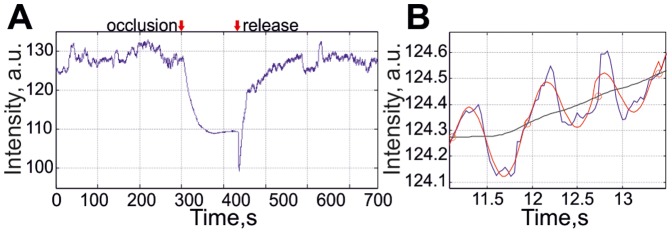
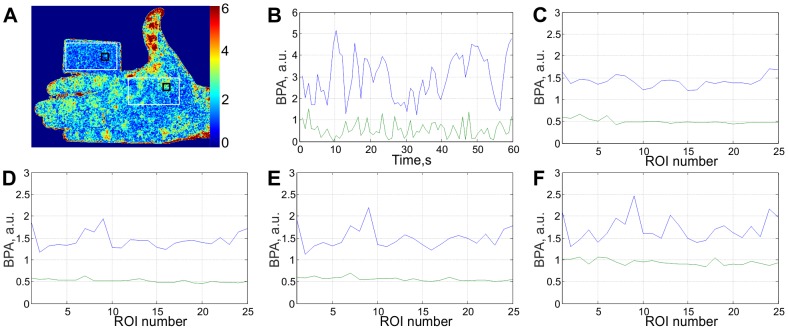
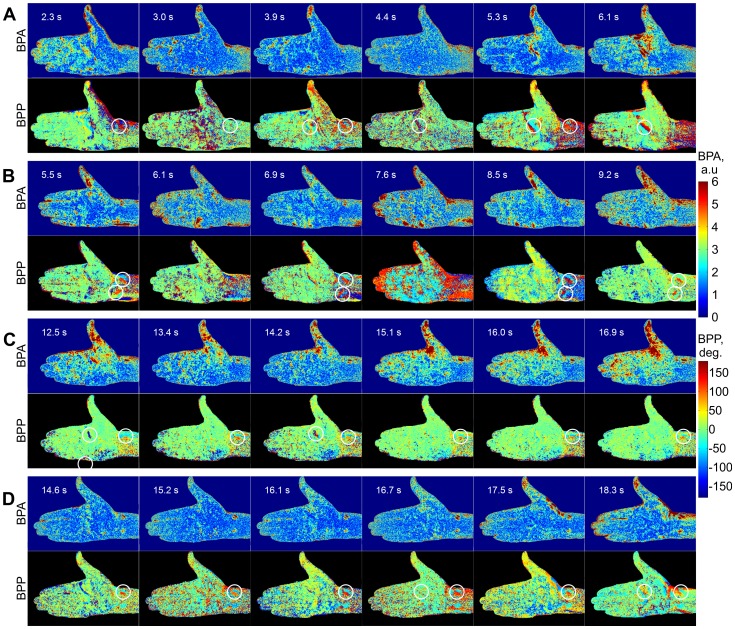
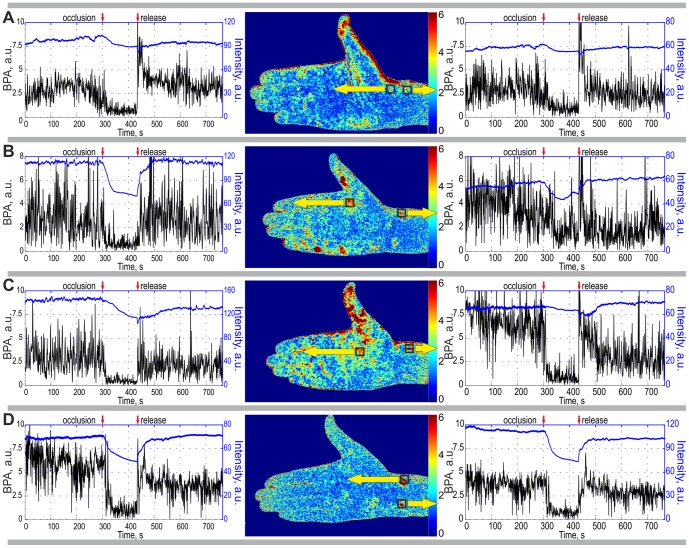
The non-invasive assessment of blood flow is invaluable for the diagnostic and monitoring treatment of numerous vascular and neurological diseases. We developed a non-invasive and non-contact method of blood pulsation imaging capable of visualizing and monitoring of the two-dimensional distribution of two key parameters of peripheral blood flow: the blood pulsation amplitude and blood pulsation phase. The method is based on the photoplethysmographic imaging in the reflection mode. In contrast with previous imaging systems we use new algorithm for data processing which allows two dimensional mapping of blood pulsations in large object's areas after every cardiac cycle. In our study we carried out the occlusion test of the arm and found (i) the extensive variability of 2D-distribution of blood pulsation amplitude from one cardiac cycle to another, and (ii) existence of the adjacent spots to which the blood is asynchronously supplied. These observations show that the method can be used for studying of the multicomponent regulation of peripheral blood circulation. The proposed technique is technologically simple and cost-effective, which makes it applicable for monitoring the peripheral microcirculation in clinical settings for example, in diagnostics or testing the efficiency of new medicines.


Conflict of interest statement

Competing Interests: The authors have declared that no competing interests exist.

Figures

Figure 1
Figure 1. Experimental setup for blood perfusion imaging.
Figure 2
Figure 2. Time traces of raw PPG signal within the palm area.
(A) An example of the signal during the complete occlusion test (about 12 min). (B) Zoomed part of the signal (blue line) with the temporal boundaries of each cardiac cycle (shown by red circles), which has been approximated to the harmonic reference signal (red dotted line). The black line in the part (B) is the raw PPG signal filtered by continuous averaging of the data over 30 frames.
Figure 3
Figure 3. Estimation of the signal-to-noise ratio.
(A) An example of 2D map of the blood pulsation amplitude for subject's arm and the cardboard; (B) Time-traces of the BPA averaged within 15×15 pixels regions shown by black rectangles in (A): the blue line for the arm and the green line for the cardboard; (C – F) Time-averaged BPA from randomly chosen regions within white rectangles sizing 30×30 (C), 15×15 (D), 8×8 (E) pixels, and for single pixel (F).
Figure 4
Figure 4. Spatial distributions of the blood pulsation amplitude (odd rows) and the relative phase of pulsations (even rows) calculated for four subjects (A–D) at sequential moments before occlusion of blood vessels.
In the left corner of each map there is indicated the starting moment (in seconds) after which these maps are calculated for each cardiac cycle. The color scales on the right show the BPA (upper, in arbitrarily units) and the relative phase (lower, in degrees). White circles on phase maps show positions of asynchronous spots.
Figure 5
Figure 5. Time traces of the BPA (black curves) and the mean intensity of the back-reflected light (blue curves) calculated for four subjects by data averaging within selected ROI of 8×8 pixels.
We placed the ROI in the ‘hot’ spots of 2D maps of the blood pulsation amplitude which are shown in the middle of each row. Yellow arrows indicate the ROI positions (which are shown in the BPA maps with the black squares) within which the respective graphs were calculated. Moments of blood vessels occlusion and its release are shown in every graph by red arrows.

References

    1. Humeau A, Steenbergen W, Nilsson H, Strömberg T (2007) Laser Doppler perfusion monitoring and imaging: novel approaches. Med Biol Eng Comput 45: 421–435. - PubMed
    1. Serov A, Steinacher B, Lasser T (2005) Full-field laser Doppler perfusion imaging and monitoring with an intelligent CMOS camera. Opt Express 13: 3681–3689. - PubMed
    1. Leutenneger M, Martin-Williams M, Harbi P, Thacher T, Raffoul W, et al. (2011) Real-time full field laser Doppler imaging. Biomed Opt Express 2: 1470–1477. - PMC - PubMed
    1. Fujii H, Asakura T, Nohira K, Shintomi Y, Ohura T (1985) Blood flow observed by time-varying laser speckle. Opt Lett 10: 104–106. - PubMed
    1. Ulyanov SS, Tuchin VV (2000) Use of low-coherence speckled speckles for bioflow measurements. Appl Opt 39: 6385–6389. - PubMed

Publication types