. 2013 Jun;12(4):424-37.
doi: 10.1111/gbb.12029. Epub 2013 Mar 20.

High-precision genetic mapping of behavioral traits in the diversity outbred mouse population

Affiliations
Free PMC article

High-precision genetic mapping of behavioral traits in the diversity outbred mouse population

R W Logan et al. Genes Brain Behav. 2013 Jun.
Free PMC article

Abstract

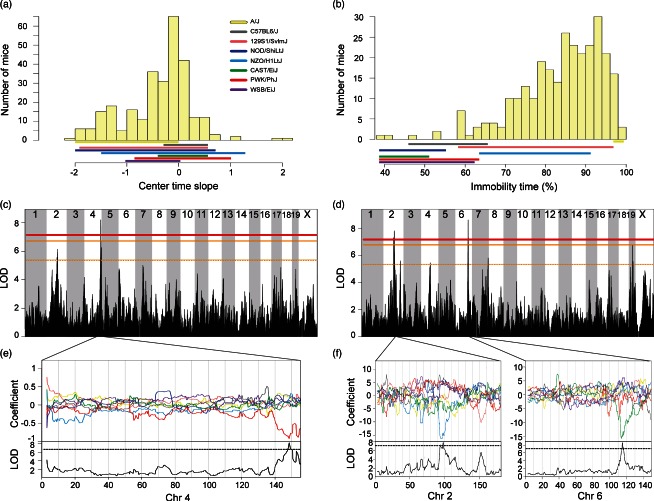
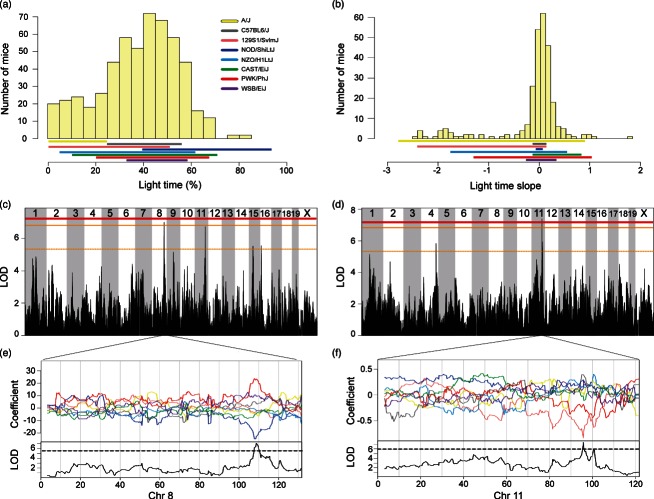
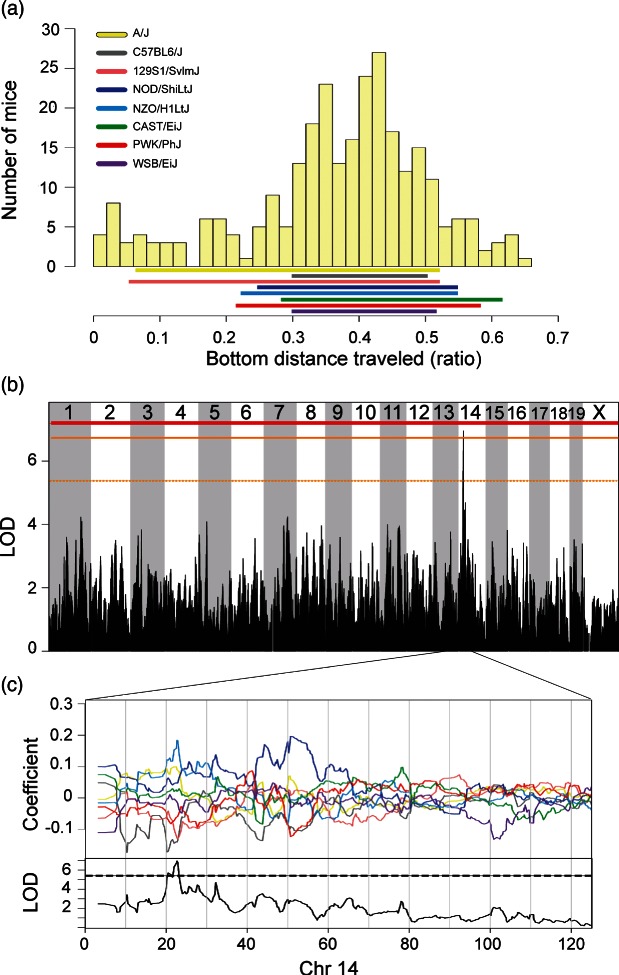
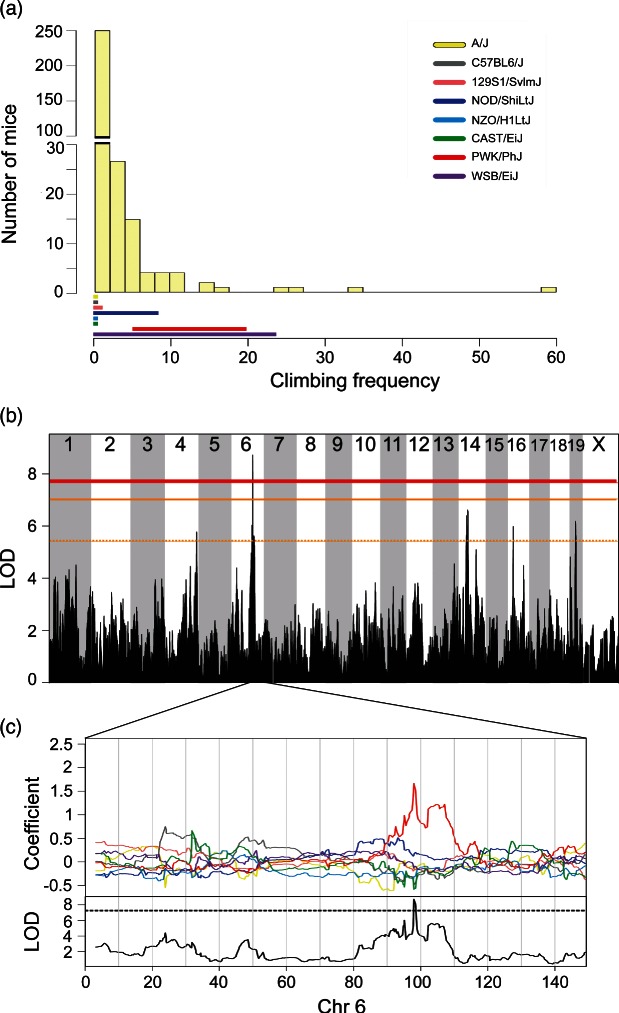
Historically our ability to identify genetic variants underlying complex behavioral traits in mice has been limited by low mapping resolution of conventional mouse crosses. The newly developed Diversity Outbred (DO) population promises to deliver improved resolution that will circumvent costly fine-mapping studies. The DO is derived from the same founder strains as the Collaborative Cross (CC), including three wild-derived strains. Thus the DO provides more allelic diversity and greater potential for discovery compared to crosses involving standard mouse strains. We have characterized 283 male and female DO mice using open-field, light-dark box, tail-suspension and visual-cliff avoidance tests to generate 38 behavioral measures. We identified several quantitative trait loci (QTL) for these traits with support intervals ranging from 1 to 3 Mb in size. These intervals contain relatively few genes (ranging from 5 to 96). For a majority of QTL, using the founder allelic effects together with whole genome sequence data, we could further narrow the positional candidates. Several QTL replicate previously published loci. Novel loci were also identified for anxiety- and activity-related traits. Half of the QTLs are associated with wild-derived alleles, confirming the value to behavioral genetics of added genetic diversity in the DO. In the presence of wild-alleles we sometimes observe behaviors that are qualitatively different from the expected response. Our results demonstrate that high-precision mapping of behavioral traits can be achieved with moderate numbers of DO animals, representing a significant advance in our ability to leverage the mouse as a tool for behavioral genetics.


Figures

Figure 1
Figure 1. Significant genome-wide QTL for behaviors in the open-field arena
Phenotypic distributions of DO mice for (a) center time slope and (b) percent time immobile. Solid colored bar below histograms represent phenotype ranges (min–max) of each progenitor strain. Significant genome-wide QTL for (c) center time slope and (d) percent time immobile. Horizontal lines represent permuted significance thresholds as follows, solid red line (significant, P < 0.05), solid (highly suggestive, P < 0.10) and dashed orange lines (suggestive, P < 0.63). Allelic effect plots of eight coefficients of the QTL mixed model representing the effect of each founder haplotype on phenotype. (e) The PWK/PhJ allele on chromosome 4 was associated with less time spent in the center of the open-field over the testing session. (f) The NZO/H1LtJ and CAST/EiJ alleles on Chrs 2 and 6 respectively, were associated with decreased mobility in the open-field. Dashed line is the maximum LOD −1.5, defining the 95% support interval of the QTL.
Figure 2
Figure 2. Significant genome-wide QTL for behaviors in the light–dark box
Phenotypic distributions of DO mice for (a) percent time spent in the light and (b) time spent in the light slope. Solid colored bar below histograms represent phenotype ranges (min–max) of each progenitor strain. Significant genome-wide QTL for (c) percent time spent in the light and (d) time spent in the light slope. Horizontal lines represent permuted significance thresholds as follows, solid red line (significant, P < 0.05), solid (highly suggestive, P < 0.10) and dashed orange lines (suggestive, P < 0.63). Allelic effect plots of eight coefficients of the QTL mixed model representing the effect of each founder haplotype on phenotype. (e) An increasor PWK/PhJ allele and a decreasor NOD/ShiLtJ on Chromosome 8 was associated with time spent in the light. (f) The 129S1/SvlmJ allele on Chromosome 11 was associated with a decreased amount of time spent in the light side over the testing session. Dashed line is the maximum LOD −1.5, defining the 95% support interval of the QTL.
Figure 3
Figure 3. Significant genome-wide QTL for behaviors in the visual-cliff avoidance test
Phenotypic distribution of DO mice for (a) ratio of distance traveled in the bottom area. Solid colored bar below histograms represent phenotype ranges (min–max) of each progenitor strain. Significant genome-wide QTL for (b) bottom distance traveled. Horizontal lines represent permuted significance thresholds as follows, solid red line (significant, P < 0.05), solid (highly suggestive, P < 0.10) and dashed orange lines (suggestive, P < 0.63). Allelic effect plots of eight coefficients of the QTL mixed model representing the effect of each founder haplotype on phenotype. (c) An increasor NZO/H1LtJ allele and a decreasor 129S1/SvlmJ allele on Chromosome 14 were associated with distance traveled in the bottom of the visual-cliff. Dashed line is the maximum LOD −1.5, defining the 95% support interval of the QTL.
Figure 4
Figure 4. Significant genome-wide QTL for behaviors during the tail-suspension test
Phenotypic distribution of DO mice for (a) climbing behavior. Solid colored bar below histograms represent phenotype ranges (min–max) of each progenitor strain. Note that this trait was log transformed before mapping to satisfy model assumptions. Significant genome-wide QTL of (b) frequency of climbing. Horizontal lines represent permuted significance thresholds as follows, solid red line (significant, P < 0.05), solid (highly suggestive, P < 0.10) and dashed orange lines (suggestive, P < 0.63). Allelic effect plots of eight coefficients of the QTL mixed model representing the effect of each founder haplotype on phenotype. (c) The PWK/PhJ allele on Chromosome 6 was associated with increased frequency of climbing. Dashed line is the maximum LOD −1.5, defining the 95% support interval of the QTL.
Figure 5
Figure 5. Narrowing QTL support interval using phylogeny and sequencing information based on allele effect estimates
(a) Allelic effect plot displaying PWK/PhJ allele association with increased climbing frequency during tail-suspension test. (b) Comparison of IBD regions between eight founder strains reveals two regions where PWK/PhJ haplotypes are different from the remaining seven founder strains. Solid lines extending below haplotype plot anchor boundaries of these regions. (c) SNP distribution plots across two regions of polymorphisms segregating only in the PWK/PhJ strain. Numerous private PWK/PhJ polymorphisms are present in these regions (vertical orange bars). Positional candidates (blue bars) in the narrowed interval are displayed below. The single Sanger SNP matching the founder effect pattern is marked with a triangle.

References

    1. Aylor DL, Valdar W, Foulds-Mathes W, et al. Genetic analysis of complex traits in the emerging Collaborative Cross. Genome Res. 2011;21:1213–1222. - PMC - PubMed
    1. Bailey JS, Grabowski-Boase L, Steffy BM, Wiltshire T, Churchill GA, Tarantino LM. Identification of quantitative trait loci for locomotor activation and anxiety using closely related inbred strains. Genes Brain Behav. 2008;7:761–769. - PMC - PubMed
    1. Bennett BJ, Farber CR, Orozco L, et al. A high-resolution association mapping panel for the dissection of complex traits in mice. Genome Res. 2010;20:281–290. - PMC - PubMed
    1. Bourin M, Hascoët M. The mouse light/dark box test. Eur J Pharmacol. 2003;463:55–65. - PubMed
    1. Bibikova M, Beumer K, Trautman JK, Carroll D. Enhancing gene targeting with designed zinc finger nucleases. Science. 2003;300:764. - PubMed

Publication types