. 2013 Mar 4;23(5):372-81.
doi: 10.1016/j.cub.2013.01.048. Epub 2013 Feb 21.

Circadian disruption leads to insulin resistance and obesity

Affiliations

Circadian disruption leads to insulin resistance and obesity

Shu-qun Shi et al. Curr Biol. .

Abstract

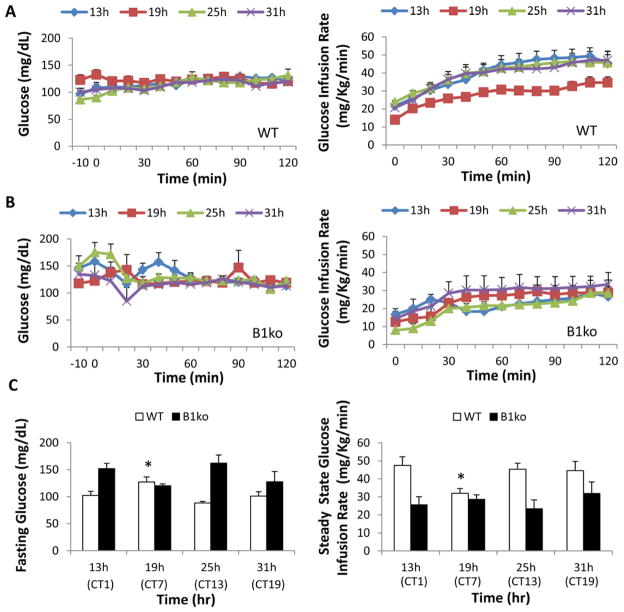
Background: Disruption of circadian (daily) timekeeping enhances the risk of metabolic syndrome, obesity, and type 2 diabetes. While clinical observations have suggested that insulin action is not constant throughout the 24 hr cycle, its magnitude and periodicity have not been assessed. Moreover, when circadian rhythmicity is absent or severely disrupted, it is not known whether insulin action will lock to the peak, nadir, or mean of the normal periodicity of insulin action.

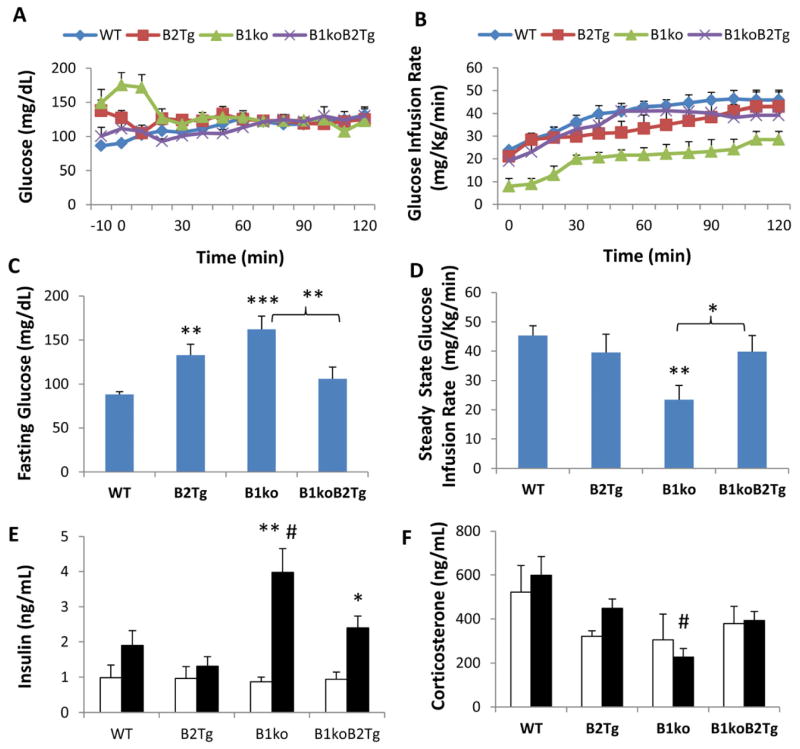
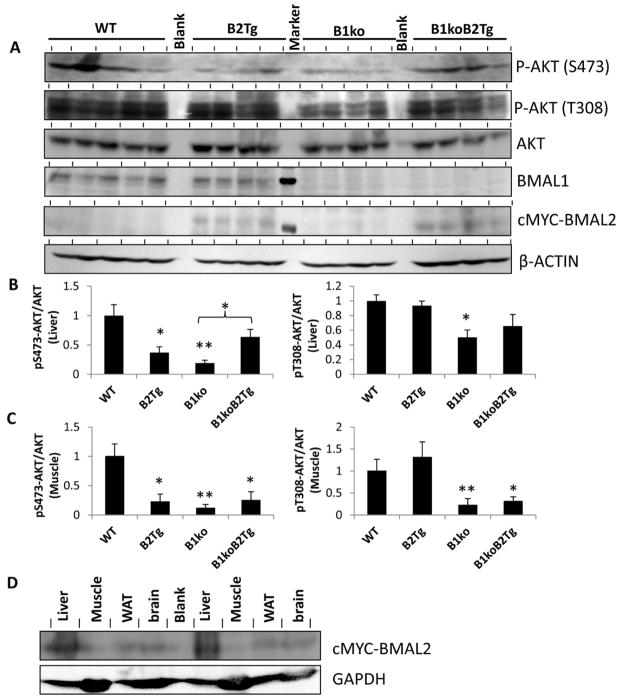
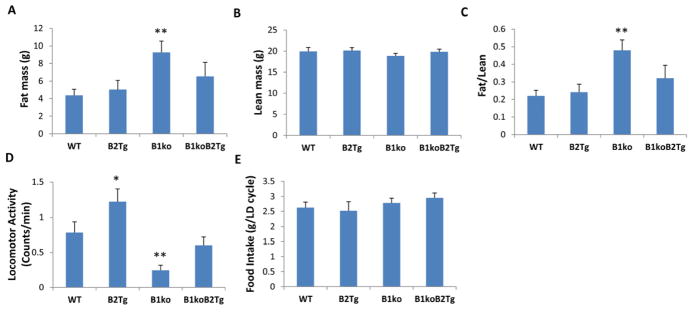
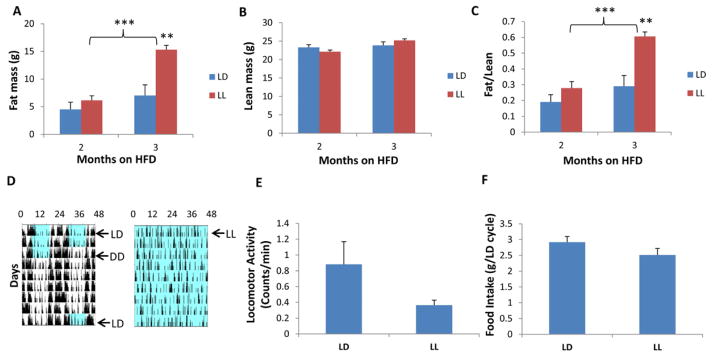
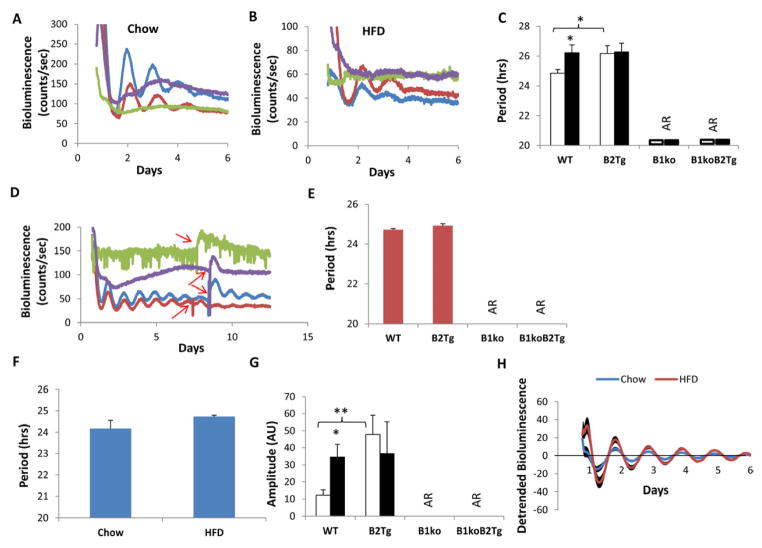
Results: We used hyperinsulinemic-euglycemic clamps to show a bona fide circadian rhythm of insulin action; mice are most resistant to insulin during their daily phase of relative inactivity. Moreover, clock-disrupted Bmal1-knockout mice are locked into the trough of insulin action and lack rhythmicity in insulin action and activity patterns. When rhythmicity is rescued in the Bmal1-knockout mice by expression of the paralogous gene Bmal2, insulin action and activity patterns are restored. When challenged with a high-fat diet, arhythmic mice (either Bmal1-knockout mice or wild-type mice made arhythmic by exposure to constant light) were obese prone. Adipose tissue explants obtained from high-fat-fed mice have their own periodicity that was longer than animals on a chow diet.

Conclusions: This study provides rigorous documentation for a circadian rhythm of insulin action and demonstrates that disturbing the natural rhythmicity of insulin action will disrupt the rhythmic internal environment of insulin sensitive tissue, thereby predisposing the animals to insulin resistance and obesity.


Conflict of interest statement

Conflict of Interest Statement:

The authors declare that they have no conflicts of interest.

Figures

Fig. 1
Fig. 1
Hyperinsulinemic-euglycemic clamps on conscious, unrestrained wild-type (WT) and Bmal1 knockout (B1ko) mice at four circadian phases under constant red light. Arterial glucose levels (left panels) and glucose infusion rates (GIR, right panels) during hyperinsulinemic-euglycemic clamps for wild-type (A) and B1ko (B) mice are shown for four time points under constant red light (CT0 = subjective dawn; CT12 = subjective dusk). The light/dark and fasting protocol prior to the clamps is shown in Fig. S1. (C, left panel) Arterial glucose levels in mice subjected to a 5-h fast (the average of -10 and 0 min prior to the start of clamps, left) during clamps for WT and B1ko mice (left panel, WT: open rectangle, B1ko: solid rectangle) at four time points. (C, right panel) Glucose infusion rates for the final 50 minutes (steady state of glucose levels) during the clamps at four circadian time points under constant red light (right panel, WT: open rectangle, B1ko: solid rectangle). The times/phases of the clamp measurements are plotted as both hours in red light and circadian time {CT}(clamp time should not be expressed in CT for B1ko mice since the clock appears to be abolished in these animals). Data are presented as mean ± SEM (WT: 6–8 mice/group, B1ko: 3–5 mice/group). Asterisks denote the phase of the WT data (CT7) that is significantly different (p < 0.05) from the other phases of the WT samples for both fasting glucose levels and GIRs as described in the text.
Fig. 2
Fig. 2
Hyperinsulinemic-euglycemic clamps on mice at 25 h in dim red light (= CT13 for WT, B2Tg, and B1ko/B2Tg mice). Arterial glucose levels (A) and glucose infusion rates (B) during insulin clamps for wild-type (WT), Bmal2 transgenic (B2Tg), Bmal1 knockout (B1ko), and Bmal1ko/Bmal2Tg (B1koB2Tg) mice. (C) arterial glucose levels for mice subjected to a 5-h fast (average of times -10 min and 0 min prior to the initiation of insulin infusion). (D) glucose infusion rates during the last 50 minutes of the clamps. Arterial insulin (E) and corticosterone (F) levels during the clamps (Open bars: Basal, Solid bars: Clamp period). Data are shown as mean ± SEM (4–7 mice per group), *p < 0.05, **p < 0.01, ***p < 0.001 compared with WT mice (panels C&D, one-way ANOVA with LSD), compared with basal levels (panels E&F, two-tail unpaired T test). # p< 0.05 compared among four genotypes (one-way ANOVA). Insulin (p < 0.001) but not corticosterone (p=0.557) levels between the basal and clamp conditions were significantly different among the four genotypes as analyzed by two-way ANOVA. Statistically significant differences among the four genotypes were revealed by one-way ANOVA for both clamp insulin levels (p = 0.011, high in B1ko) and clamp corticosterone levels (p = 0.016, lower in B1ko). Two-way ANOVA analyses of strain X phase interaction indicated a significant difference for insulin levels (p = 0.013), but not for corticosterone levels (p = 0.674).
Fig. 3
Fig. 3
Regulation of AKT pathway signaling by Bmal1/2. (A) Immunoblots from liver extracts for phospho-AKT (p-AKT S473 and T308), AKT (total), BMAL1, cMYC-BMAL2 (cMYC-tagged BMAL2 is the version of BMAL2 expressed in the B2Tg and B1ko/B2Tg mice, ref. 16), and β-ACTIN of mice after hyperinsulinemic-euglycemic clamps. Each lane comes from a separate mouse (n = 5 for WT, n = 4 for the other groups). The lane between the B2Tg and the B1ko samples in the BMAL1 and cMYC-BMAL2 blots shows a molecular weight standard indicating 75 kD. (B) Densitometric analyses of the data shown in panel A for liver extracts. Expression of AKT-pS473 and AKT-pT308 were normalized to total AKT. (C) Densitometric analyses of the data for muscle extracts analyzed and plotted as in panel B (see Fig. S2 for the raw immunoblot data). For panels B and C, the value of WT was set as 1.0, and values are expressed as mean ± SEM of integrated intensity. (D) Expression of cMYC-BMAL2 in various tissues of B1ko/B2Tg mice. Results from two representative mice are shown for liver, muscle, white adipose tissue (WAT) and brain tissues. The blot for cMYC-BMAL2 (upper blot) is compared with a blot for a control protein (GAPDH, lower blot). In all panels, *p < 0.05, ** p < 0.01 compared with WT or as indicated.
Fig. 4
Fig. 4
Body composition, food consumption, and locomotor activity in four different strains of mice fed a high-fat-diet (HFD). Mice were fed HFD starting at an age of one month and maintained under LD 12:12 (12 hr light: 12 hr dark, lights on 6:00 am–6:00 pm). (A) Fat mass of these mice at age 3 months (2 months on HFD), and (B) Lean mass of these mice at age 3 months (2 months on HFD). Each bar represents mean ± SEM (n = 12–16/genotype). (C) Ratio of fat mass to lean mass. (D) Locomotor activity recorded by infrared sensors in these mice at 3 months of age in LD. (mean ± SEM, n = 7–10/genotype). (E) Daily food intake during one 24 h LD cycle (mean ± SEM, n = 7–10/genotype). *p<0.05 and **p<0.01 compared with WT mice (one-way ANOVA with LSD).
Fig. 5
Fig. 5
Body composition, food consumption, and locomotor activity in high-fat diet fed wild type male mice under light-dark (LD 12:12) or constant light (LL) conditions. Mice were fed RC until they were one month old, then transferred to HFD at one month under either regular LD 12:12 (lights on 6am–6pm) or LL. (A) Fat mass, and (B) lean mass of 3 and 4 month-old WT male mice. Mice were fed with high-fat diet under either LD 12:12 (blue) or LL (red). (C) Ratio of fat mass to lean mass. Each bar represents mean ± SEM. (D) Representative locomotor activity patterns recorded by infrared sensors. Blue shading denotes illumination, while white denotes darkness. (left panel is LD 12:12 -> DD -> LD 12:12, right panel is LL). (E) Activity levels are expressed as mean counts/min ± SEM. (F) Daily food intake is expressed as mean grams intake per 24 h LD cycle ± SEM. n = 5–7 per treatment, **p<0.01 and ***p<0.001 compared with mice in LD (two-tail unpaired T test).
Fig. 6
Fig. 6
Per2 expression measured as luminescence emanating from tissues of the PmPer2::mPER2-Luc reporter mouse [49]. WAT and SCN explants were dissected and recorded with a LumiCycle apparatus in vitro. (A, B) Representative raw data of luminescence monitored in vitro from WAT of PmPer2::mPER2-Luc knock-in mice fed with either chow (panel A) or high-fat diet (HFD, panel B). Colors denote: WT (blue), B2Tg (red), B1ko (green) and B1ko/B2Tg (purple). (C) Period of Per2::luc luminescence rhythms from WAT explant cultures as mean ± SEM (Chow: white, n = 6–8/genotype; High Fat Diet {HFD}: black, n = 5–7/genotype). (D) Representative data of luminescence monitored in vitro from SCN slices of mice harboring PmPer2::mPER2-Luc and fed with high-fat diet (HFD). After 7–8 days in culture, the SCN slices were given a 0.5-hour pulse of 10 μM forskolin at the times indicated by red arrows (in vitro cultures were maintained at 36.5°C). Blue: WT, Red: B2Tg, Green: B1ko, Purple: B1koB2Tg. (E) Period of SCN cultures from HFD-fed mice. Each bar represents mean ± SEM, n = 5–7/genotype. (F) Period of SCN cultures from WT mice fed with chow or HFD. Each bar represents mean ± SEM, Chow: n=8, HFD: n=7. (G) Amplitude of SCN cultures in arbitrary units (AU) from chow (open rectangle, n = 6–8/genotype) or HFD-fed mice (solid rectangle, n = 5–7). (H) Detrended bioluminescence rhythms from cultured SCN slices of WT mice harboring PmPer2::mPER2-Luc and fed with chow or high-fat diet (HFD). Each trace represents mean ± SEM (Chow: n=8; HFD: n=7). *p<0.05; **p<0.01 compared with chow fed mice or as indicated (2-tail unpaired T test).

References

    1. Dunlap JC, Loros JJ, DeCoursey PJ. Chronobiology: Biological Timekeeping. Sunderland, MA: Sinauer Associates, Inc; 2004.
    1. Green CB, Takahashi JS, Bass J. The meter of metabolism. Cell. 2008;134:728–42. - PMC - PubMed
    1. Scheer FA, Hilton MF, Mantzoros CS, Shea SA. Adverse metabolic and cardiovascular consequences of circadian misalignment. Proc Natl Acad Sci U S A. 2009;106:4453–4458. - PMC - PubMed
    1. Gimble JM, Sutton GM, Bunnell BA, Ptitsyn AA, Floyd ZE. Prospective influences of circadian clocks in adipose tissue and metabolism. Nat Rev Endocrinol. 2011;7:98–107. - PubMed
    1. Antunes LC, Levandovski R, Dantas G, Caumo W, Hidalgo MP. Obesity and shift work: chronobiological aspects. Nutr Res Rev. 2010;23:155–68. - PubMed

Publication types