. 2013 Feb 28;152(5):1077-90.
doi: 10.1016/j.cell.2013.01.053. Epub 2013 Feb 21.

CXCR4/CXCL12 mediate autocrine cell- cycle progression in NF1-associated malignant peripheral nerve sheath tumors

Affiliations

CXCR4/CXCL12 mediate autocrine cell- cycle progression in NF1-associated malignant peripheral nerve sheath tumors

Wei Mo et al. Cell. .

Abstract

Malignant peripheral nerve sheath tumors (MPNSTs) are soft tissue sarcomas that arise in connective tissue surrounding peripheral nerves. They occur sporadically in a subset of patients with neurofibromatosis type 1 (NF1). MPNSTs are highly aggressive, therapeutically resistant, and typically fatal. Using comparative transcriptome analysis, we identified CXCR4, a G-protein-coupled receptor, as highly expressed in mouse models of NF1-deficient MPNSTs, but not in nontransformed precursor cells. The chemokine receptor CXCR4 and its ligand, CXCL12, promote MPNST growth by stimulating cyclin D1 expression and cell-cycle progression through PI3-kinase (PI3K) and β-catenin signaling. Suppression of CXCR4 activity either by shRNA or pharmacological inhibition decreases MPNST cell growth in culture and inhibits tumorigenesis in allografts and in spontaneous genetic mouse models of MPNST. We further demonstrate conservation of these activated molecular pathways in human MPNSTs. Our findings indicate a role for CXCR4 in NF1-associated MPNST development and identify a therapeutic target.


Figures

Figure 1
Figure 1
CXCR4 is overexpressed in MPNSTs. (A) Schema of the microarray analyses. (B) qRT-PCR analysis of CXCR4 mRNA levels in WT, Nf−/− and NP−/− (Nf−/−;p53−/−) SKPs, as well as MPNST SKP model tumors and the cells derived from the tumor. (C) Western blot analysis of CXCR4 protein levels in Nf−/− and NP−/−SKPs, and SMPNST cancer cells. (D) Quantification of CXCR4-positive cells in tumor tissues from different mouse models of MPNST and an MPNST from an NF1 patient (SMPNST = SMPNST autograft; athymic model = SMPNST allograft). All statistics represent mean ± SD. See also Figure S1.
Figure 2
Figure 2
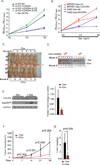
Knockdown of CXCR4 expression in MPNST cells decreased proliferation in vitro and tumorigenesis in vivo. (A and B) ATP luminescence assays were used to measure growth of indicated cells. (C and D) Representative pictures of the tumors from nude mice injected with SMPNST-Tripz-mCXCR4 cells. Mice #1-6: without Dox treatment; Mice #7-12: Dox treatment. (E) CXCR4 protein level is down-regulated in dox-treated MPNSTs. (F) Kinetic curve of tumor growth as measured by tumor volume. (G) Quantification of tumor weight. All statistics represent mean ± SD. See also Figure S2.
Figure 3
Figure 3
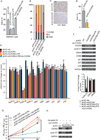
CXCR4 alters the cell cycle in SMPNST cells by regulating cyclin D1 expression. SMPNST cells were incubated with BrdU for 30 min and then stained with propidium iodide. (A and B) FACS analysis showed that CXCR4 depletion in SMPNST cells decreased the percentage of BrdU-positive cells (pLKO-mCXCR4 and pLKO-mCXCR4-UTR compared to control pLKO-ctrl) (A) and altered the proportion of cells in G1 and S phase (B). Expression of CXCR4 in the knockdown cells (pLKO-mCXCR4-UTR + Ub-CXCR4) restored the cells to the control state. (C) Paraffin sections of MPNSTs (harvested from SMPNST-allograft mice injected with either control pLKO-ctrl or CXCR4-depleted pLKO-mCXCR4 SMPNST cells) were stained with antibody against BrdU and counterstained with hematoxylin (blue). (D) The percentage of SMPNST cells that were BrdU-positive was determined for each tumor. (E and F) Analysis of the expression levels of various cell cycle genes/proteins in the indicated cells as measured by qPCR (E) and western blotting (F). (G) Cell growth curves of indicated cells as measured with an ATP luminescence assay. (H) CXCR4 and cyclin D1 protein levels were examined by western blotting in indicated cells. Scale bar: 50 um. All statistics represent mean ± SD. (*p< 0.05; **p< 0.01). See also Figure S3.
Figure 4
Figure 4
CXCR4 regulates cyclin D1 expression through the AKT/GSK-3β/β-catenin network. (A) Immunoblot of nuclear and cytoplasmic extracts from SMPNST cells with indicated antibodies. (B) Luciferase reporter assay to measure TCF activation in control SMPNST cells (pLKO-ctrl), CXCR4-depleted SMPNST cells (pLKO-mCXCR4, pLKO-mCXCR4-UTR), CXCR4-depleted SMPNST cells rescued by CXCR4 overexpression (pLKO-mCXCR4-UTR+Ub-CXCR4), and SMPNST cells expressing dominant-negative Tcf (pLKO-ctrl+Ub-dnTcf). (C and D) The mRNA and protein levels of cyclin D1 in SMPNST cells (ctrl) or SMPNST cells expressing dnTcf (dnTcf) were determined either by qPCR assay (C) or western blotting (D). (E) Immunoblot of cell lysates from SMPNST cells, CXCR4-depleted SMPNST cells and CXCR4-depleted SMPNST cells ectopically expressing CXCR4 or β-catenin with indicated antibodies (ABC = antibody against activated β-catenin). (F) ATP luminescence assay to measure growth of indicated cells. (G) Immunoblot of cell lysates from SMPNST cells and CXCR4-depleted SMPNST cells with indicated antibodies. (H) Graph showing fold-change versus control of tumor tissue lysates from control SMPNSTs (ctrl) or SMPNSTs from CXCR4-depleted cells (mCXCR4) with indicated antibodies. All statistics represent mean ± SD. (**p< 0.01). See also Figure S4.
Figure 5
Figure 5
An autocrine mechanism involving CXCL12 and CXCR4 maintains growth of MPNST cells. (A and B) Growth curve of SMPNST cells treated with recombinant CXCL12 protein (A) or CXCL12/CXCR4 antibodies (B). (C) ELISA to measure CXCL12 protein level in PBS, 5% FBS DMEM media, and conditioned media from SMPNST cells or SMPNST cells expressing pBabe-CXCL12 (overexpression) or pLKO-CXCL12 (knockdown). (D) Growth curve of control SMPNST cells (pLKO ctrl) and CXCL12-depleted SMPNST cells (pLKO-CXCL12). (E) Growth curve of SMPNST cells, CXCR4-or CXCL12-depleted SMPNST cells and CXCR4-or CXCL12-depleted SMPNST cells treated with recombinant CXCL12 protein. (F) Immunoblot of cell lysates from SMPNST cells and SMPNST cells expressing pLKO-CXCL12 or pBabe-CXCL12 with indicated antibodies. All statistics represent mean ± SD. (**p< 0.01). See also Figure S5.
Figure 6
Figure 6
AMD3100 specifically inhibits the proliferation of SMPNST cells and suppresses the growth of MPNSTs in vivo. (A and B) Dose curve showing effect of AMD3100 on proliferation of murine (primary cells from MPNST SKP model and cisNP model) and human (SNF 02.2, SNF 96.2, S462 and primary cells from a human NF1 patient) MPNST cells, pre-tumor SKP NP−/−cells and WT murine Schwann cells and SKPs. (C) Experimentally-derived AMD3100 IC50 values. (D) Immunoblot with the indicated antibodies of cell lysates from murine cells in the absence or presence of AMD3100. (E) Representative picture of the SMPNST-allograft tumors (from nude mice injected with SMPNST cells) during the treatment study, with tumor histopathology and immunohistochemistry. (G) Kaplan-Meier survival curve of mice in the AMD3100 treatment study (control group, n=9; AMD3100-treated group, n=16; p=0.0017 by Mantel-Cox test). Other statistics represent mean ± SD. See also Figure S6.
Figure 7
Figure 7
Analysis of CXCR4 expression and downstream pathway signaling reveals conservation in human MPNSTs. (A) Quantification of the intensity and distribution of CXCR4 immunoreactive cells in all MPNST tissue microarrays (TMAs). (B) Schema of the CXCR4 distribution in TMAs. Spearman correlation identified a statistically significant difference between NF1-associated and sporadic tumors (p=0.0008). (C) Spearman correlation coefficient analyses between CXCR4, pAKT, β-catenin and cyclin D1 in NF1-MPNST. (D) Quantification of pAKT, β-catenin, and cyclin D1 expression levels in MPNST-NF1 TMA, and categorization based on CXCR4 expression level. Staining distribution of positively staining cells: (0) = <5%, (1) = 5–30%, (2) >30%), and intensity: (0) = negative, (1) = low, and (2) = intermediate to high. Spearman's correlation coefficient analyses were used to determine the concordance between CXCR4 expression and NF1 status, and between CXCR4 and other biomarkers.

Comment in

References

    1. Balkwill F. The significance of cancer cell expression of the chemokine receptor CXCR4. Semin Cancer Biol. 2004;14:171–179. - PubMed
    1. Bertolini F, Dell'Agnola C, Mancuso P, Rabascio C, Burlini A, Monestiroli S, Gobbi A, Pruneri G, Martinelli G. CXCR4 neutralization, a novel therapeutic approach for non-Hodgkin's lymphoma. Cancer Res. 2002;62:3106–3112. - PubMed
    1. Bian XW, Yang SX, Chen JH, Ping YF, Zhou XD, Wang QL, Jiang XF, Gong W, Xiao HL, Du LL, et al. Preferential expression of chemokine receptor CXCR4 by highly malignant human gliomas and its association with poor patient survival. Neurosurgery. 2007;61:570–578. discussion 578–579. - PubMed
    1. Burger JA, Burger M, Kipps TJ. Chronic lymphocytic leukemia B cells express functional CXCR4 chemokine receptors that mediate spontaneous migration beneath bone marrow stromal cells. Blood. 1999;94:3658–3667. - PubMed
    1. Cichowski K, Shih TS, Schmitt E, Santiago S, Reilly K, McLaughlin ME, Bronson RT, Jacks T. Mouse models of tumor development in neurofibromatosis type 1. Science. 1999;286:2172–2176. - PubMed

Publication types