. 2013 Apr 11;50(1):29-42.
doi: 10.1016/j.molcel.2013.01.022. Epub 2013 Feb 21.

Class IA PI3K p110β subunit promotes autophagy through Rab5 small GTPase in response to growth factor limitation

Affiliations

Class IA PI3K p110β subunit promotes autophagy through Rab5 small GTPase in response to growth factor limitation

Zhixun Dou et al. Mol Cell. .

Abstract

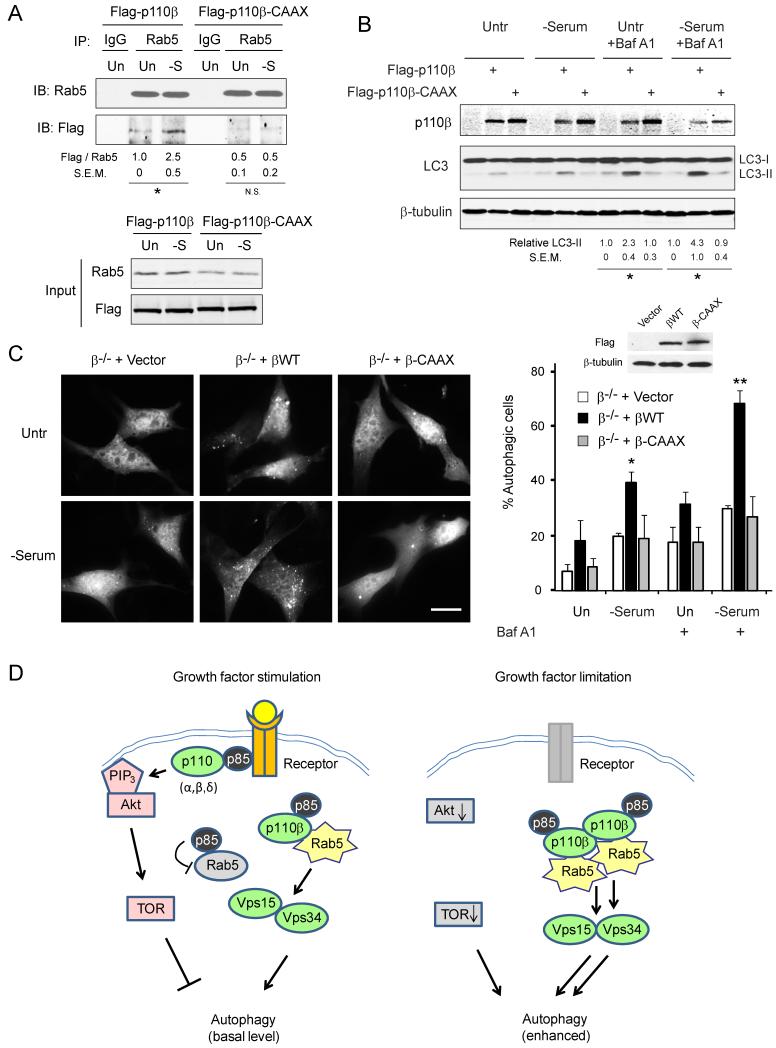
Autophagy is an evolutionarily conserved membrane trafficking process. Induction of autophagy in response to nutrient limitation or cellular stress occurs by similar mechanisms in organisms from yeast to mammals. Unlike yeast, metazoan cells rely more on growth factor signaling for a wide variety of cellular activities including nutrient uptake. How growth factor availability regulates autophagy is poorly understood. Here we show that, upon growth factor limitation, the p110β catalytic subunit of the class IA phosphoinositide 3-kinases (PI3Ks) dissociates from growth factor receptor complexes and increases its interaction with the small GTPase Rab5. This p110β-Rab5 association maintains Rab5 in its guanosine triphosphate (GTP)-bound state and enhances the Rab5-Vps34 interaction that promotes autophagy. p110β mutants that fail to interact with Rab5 are defective in autophagy promotion. Hence, in mammalian cells, p110β acts as a molecular sensor for growth factor availability and induces autophagy by activating a Rab5-mediated signaling cascade.


Figures

Figure 1
Figure 1. Rab5 plays a critical role in p110β-mediated autophagy
β+/+ and β−/− MEFs were transfected with GFP-LC3 together with indicated expression constructs. (A) Western blots of cell lysates were probed with the indicated antibodies. Ponceau S staining shows equal protein loading. (B) Cells were imaged under a deconvolution microscope. Cells with more than 10 cytosolic puncta and diminished nuclear GFP were considered as autophagic. Data are averages of at least 4 blind countings with over 200 cells. Error bars: SD. * p<0.005. (C) Representative images of GFP-LC3 fluorescence in MEFs. Scale bar: 20 μm. (D) β+/+ and β−/− MEFs were transfected with vector (control), GFP-Rab5-WT, or GFP-Rab5-CA. 48 h later, cells were left untreated or treated with 50 nM bafilomycin A1 for 6 h. Relative levels of LC3-II against β-tubulin from three independent experiments are shown on the right. Data were normalized against that of β+/+. Error bars: SEM; * p<0.05; N.S., non-significant.
Figure 2
Figure 2. p110β promotes Rab5 activation
(A) HEK293T cells were transfected with GFP-tagged Rab5-WT, Rab5-DN, or Rab5-CA. 48 h post transfection, cell lysates were subjected to pull-down with GST (control) or GST-R5BD beads. Western blots of precipitates and total cell lysates were probed with GFP antibody. (B) Lysates of MEFs with the indicated genotypes were subjected to GST or GST-R5BD pull-down, and western blotting was used to analyze endogenous Rab5-GTP levels. Relative levels of Rab5-GTP (expressed as normalized Rab5-GTP/total Rab5 ratios) are shown on the right. Data are means of three independent experiments ± SEM; * p<0.05; N.S., non-significant. (C) β−/− MEFs and those stably reconstituted with wild-type p110β or the kinase-dead K805R mutant were analyzed for Rab5-GTP by the GST-R5BD pull-down assay. Relative levels of Rab5-GTP are shown on the right. Data are average values of three independent experiments ± SEM; * p<0.05; N.S., non-significant. (D) MEFs with the indicated genotypes were subjected to immunoprecipitation with control IgG or Rab5 antibody and analyzed for endogenous Vps34 and EEA1. Immunoblots of the precipitates and the input were probed with the indicated antibodies.
Figure 3
Figure 3. p110β suppresses the Rab5 GAP activity of p85 α
(A) β+/+ and β−/− MEFs were stably infected with lentivirus encoding a non-targeting control shRNA or shRNA against p85α. (B) MEFs generated as in (A) were subjected to GST-R5BD pull-down assays to detect Rab5-GTP. Note that p85α silencing leads to increased levels of Rab5-GTP. Relative levels of Rab5-GTP (expressed as normalized ratios of Rab5-GTP/total Rab5) from three independent experiments are shown on the right. Error bars: SEM; * p<0.05; ** p<0.01. (C) MEFs generated as in (A) were transfected with GFP-LC3 and autophagic cells were quantified. The data are average of at least four blind countings with over 200 cells. Error bars: SD. * p<0.05; ** p<0.001. (D) MEFs generated as in (A) were transfected with mCherry-GFP-LC3. 48 h later, images were taken, and yellow and red puncta were counted. Data are mean values of over 20 cells ± SEM. * p<0.01; ** p<0.001. (E) Purified Rab5 (200 nM) was loaded with GDP or GTP and subjected to pull-down with GST or GST-R5BD beads. The precipitates were analyzed for Rab5-GTP. (F) For in vitro Rab5 GAP assays, 200 nM Rab5-GTP was incubated in the absence of (−), or in the presence of 1 μM (+) or 2 μM (++) of purified p85α, p110β/p85α, or p110α/p85α. Rab5-GTP was then pulled down with GST-R5BD beads and quantified by immunoblotting. The relative amounts of Rab5-GTP are shown. The quantification of Rab5-GTP levels in control and 1 μM of purified p85α, p110β/p85α is shown. Data presented are the mean values from 3 independent experiments. Error bars: SEM. * p<0.05. (G) 200 nM Rab5-GTP was incubated with 2 μM p85α in the absence or presence of 1 μM (+) or 2 μM (++) of p110β/p85α or p110α/p85α. Rab5 GAP activity was assessed as in (F). The relative amounts of Rab5-GTP are shown. (H) HEK293T cells were transfected with Flag-p85α expressing construct. 48 h later, cell lysates were divided into 4 aliquots and mixed with HEK293T cell lysates that overexpressed untagged-p85α alone or together with p110β wild-type or p110β Q596C. The mixed lysates were subjected to pull-down with GST (control) or GST-Rab5 loaded with GTPγS. The precipitates and the input were analyzed as indicated. The relative amount of Flag-p85α against Rab5 is shown.
Figure 4
Figure 4. Association of p110β with Rab5 is required for Rab5 activity and autophagy
(A) HEK293T cells were transfected with Myc-tagged p110α or p110β constructs together with Flag-p85α. 48 h later, cell lysates were subjected to pull-down with GST or GST-Rab5 loaded with GTPγS. (B) p110β-Q596C and p110β-I597S possess intact kinase activity. The lipid kinase activity assay was performed as previously described (Dbouk et al., 2010). Data presented are the means of three independent experiments, normalized against that of p110β protein levels. Error bars: SEM. (C) HEK293T cells were transfected with indicated constructs. 48 h later, cell lysates were subjected to immunoprecipitation with Myc-antibody conjugated to agarose. Blots of the precipitates and the input were probed with Myc and Flag antibodies. (D) β−/− MEFs were stably reconstituted with indicated constructs and were analyzed for indicated proteins. (E) Lysates of stably reconstituted MEFs were subjected to GST-R5BD pull-down assays to determine the amount of Rab5-GTP. The relative amount of Rab5-GTP against total Rab5 is shown. Error bars: SEM; n=3; * p<0.05. (F) MEFs were analyzed for p62. The relative amount of p62 is shown. Error bars: SEM; n=3; * p<0.05. (G) MEFs as indicated were incubated with [14C]valine for 24 h. The cells were left untreated or serum-starved for 4 h. Degradation of long-lived proteins was measured. Error bars: SEM; n=3; * p<0.05. (H) MEFs generated as in (D) were cultured in complete or serum-free medium for 6 h and treated with or without bafilomycin A1 (50 nM). Western blots of cell lysates were probed for LC3 and β-tubulin. Quantification of LC3-II against β-tubulin is shown. Error bars: SEM; n=3; * p<0.05. (I) MEFs generated as in (D) were transfected with GFP-LC3. 48 h later, cells were cultured in complete or serum-free medium for 4 h, in the absence or presence of bafilomycin A1 (50 nM). Representative images of cells without bafilomycin A1 treatment are shown. Scale bar: 20 μm. Quantification of autophagic cells is shown on the right. Data are average values of at least 4 blind countings with over 200 cells. Error bars: SD; * p<0.05; ** p<0.01.
Figure 5
Figure 5. Withdrawal of growth factors, but not nutrients, induces p110β-Rab5 binding and p110β-dependent Rab5 activation
(A) β−/− MEFs stably reconstituted with human p110β (hp110β) were left untreated, deprived of serum, glucose, or amino acids for 6 h, or treated with the Akt inhibitor (Akti, 10 μM) or rapamycin (Ra, 50 nM) overnight. (B) Lysates of cells treated as in (A) were subjected to immunoprecipitation with control IgG or Rab5 antibody. The precipitates were analyzed for Rab5, hp110β, and Vps34. (C) β+/+ and β−/− MEFs were left untreated or serum-deprived for 6 h. GST-R5BD pull-down assays were done to determine the amount of Rab5-GTP in cell lysates. The mean values of relative Rab5-GTP against that of total Rab5 from three independent experiments with SEM is shown. * p<0.05; N.S., non-significant. (D) β+/+, β−/−, and the human p110β-reconstituted β−/− MEFs were cultured in complete or serum-free medium for 6 h. Cell lysates were subjected to immunoprecipitation with IgG or Rab5 antibody and analyzed for human p110β and endogenous Vps34 and EEA1. (E) MEFs as indicated expressing GFP-FYVE were untreated or serum-starved, and stained for endogenous Rab5. Around 20 cells were randomly selected and imaged. The numbers of GFP-FYVE puncta and colocalized GFP-FYVE and Rab5 puncta per cell were quantified. Error bars: SEM; * p<0.005; ** p<0.0005. The representative images are shown in Suppl. Figure S5B.
Figure 6
Figure 6. p110β dissociates from growth factor receptor complexes and interacts with Rab5 upon growth factor deprivation
(A and B) MCF10A cells were grown in complete or basal (without growth factors) medium for 24 h. Cell lysates were subjected to immunoprecipitation with the indicated antibodies or with phosphotyrosine antibody conjugated to agarose. Western blotting of the precipitates and the input is shown. Quantification of each association is shown (A). (B) Immunofluorescence confocal microscopy was used to visualize endogenous p110β and Rab5 in fixed cells. Representative images are shown. Scale bar: 10 μm. The percentage of Rab5 colocalizing with p110β was quantified in over 50 cells and is shown on the right. Error bars: SEM. * p<0.01. (C) MCF10A cells were stably infected with lentiviruses encoding a tetracycline-inducible non-targeting control shRNA or shRNA against p110β. The two cell lines were treated in complete medium with doxycycline (Dox, 1 μg/ml) for the indicated times and then harvested for western blotting. (D) MCF10A cells generated as in (C) were treated with Dox for 3 d to silence p110β, then cultured in complete or basal medium for 24 h in the presence of Dox. Cell lysates were analyzed for the amount of Rab5-GTP using GST-R5BD pull-down assays. The input of Rab5 and p110β are shown. n.s., non-specific band. (E) Cells generated as in (C) stably expressing GFP-LC3 were left untreated or starved in basal medium for 24 or 48 h in the absence or presence of bafilomycin A1 (20 nM). Representative images of cells not treated with bafilomycin A1 are shown. Scale bar: 20 μm. Autophagic cells from the indicated culture conditions were quantified and shown in (F). Data are averages of at least 4 blind countings with over 500 cells. Error bars: SD. (G) MCF10A cells were stably infected with tetracycline-inducible control shRNA or shRNA against p110β. Cells were treated with Dox for 3 d to allow knock-down of p110β. Cells were then left untreated or cultured in basal medium for 36 h in the absence or presence of bafilomycin A1 (20 nM). Short and long exposures of the LC3 immunoblots are shown. Relative amount of LC3-II normalized against β-tubulin was quantified from three independent experiments. Error bars: SEM; * p<0.05; N.S., non-significant.
Figure 7
Figure 7. Cells with membrane-targeted p110β-CAAX display impaired Rab5 association and autophagy
(A) HEK293T cells were transfected with wild-type Flag-p110β or Flag-p110β-CAAX. 48 h later, cells were left untreated or serum-deprived for 24 h. Cell lysates were subjected to immunoprecipitation with IgG or Rab5 antibody. The normalized relative binding of Flag-p110β to Rab5 from three independent experiments with SEM is shown. * p<0.05; N.S., non-significant. (B) β−/− MEFs expressing indicated constructs were left untreated or serum-deprived in the absence or presence of bafilomycin A1 (50 nM) for 6 h. The relative amount of LC3-II normalized against that of vector control from three independent experiments with SEM is shown. * p<0.05, comparing wild-type p110β versus vector and p110β-CAAX mutant. (C) β−/− MEFs were transfected with the indicated constructs together with GFP-LC3. 48 h later, cells were left untreated or serum-deprived for 6 h, in the absence or presence of bafilomycin A1 (50 nM). The pictures shown are of cells in the absence of bafilomycin A1. Scale bar: 20 μm. Expression of the constructs and quantification of autophagic cells are shown on the right. Data are average of 4 blind countings with over 200 cells. Error bars: SD; * p<0.05; ** p<0.005. (D) Schematic representation of the role of p110β in regulating autophagy. See text for explanation.

References

    1. Barbieri MA, Li G, Colombo MI, Stahl PD. Rab5, an early acting endosomal GTPase, supports in vitro endosome fusion without GTP hydrolysis. J Biol Chem. 1994;269:18720–18722. - PubMed
    1. Cantley LC. The phosphoinositide 3-kinase pathway. Science. 2002;296:1655–1657. - PubMed
    1. Carpenter CL, Duckworth BC, Auger KR, Cohen B, Schaffhausen BS, Cantley LC. Purification and characterization of phosphoinositide 3-kinase from rat liver. J Biol Chem. 1990;265:19704–19711. - PubMed
    1. Castellano E, Downward J. RAS Interaction with PI3K: More Than Just Another Effector Pathway. Genes Cancer. 2011;2:261–274. - PMC - PubMed
    1. Chagpar RB, Links PH, Pastor MC, Furber LA, Hawrysh AD, Chamberlain MD, Anderson DH. Direct positive regulation of PTEN by the p85 subunit of phosphatidylinositol 3-kinase. Proc Natl Acad Sci U S A. 2010;107:5471–5476. - PMC - PubMed

Publication types

MeSH terms

Substances