. 2013 Mar;123(3):1157-75.
doi: 10.1172/JCI63672. Epub 2013 Feb 22.

Sprouty2, PTEN, and PP2A interact to regulate prostate cancer progression

Affiliations

Sprouty2, PTEN, and PP2A interact to regulate prostate cancer progression

Rachana Patel et al. J Clin Invest. 2013 Mar.

Abstract

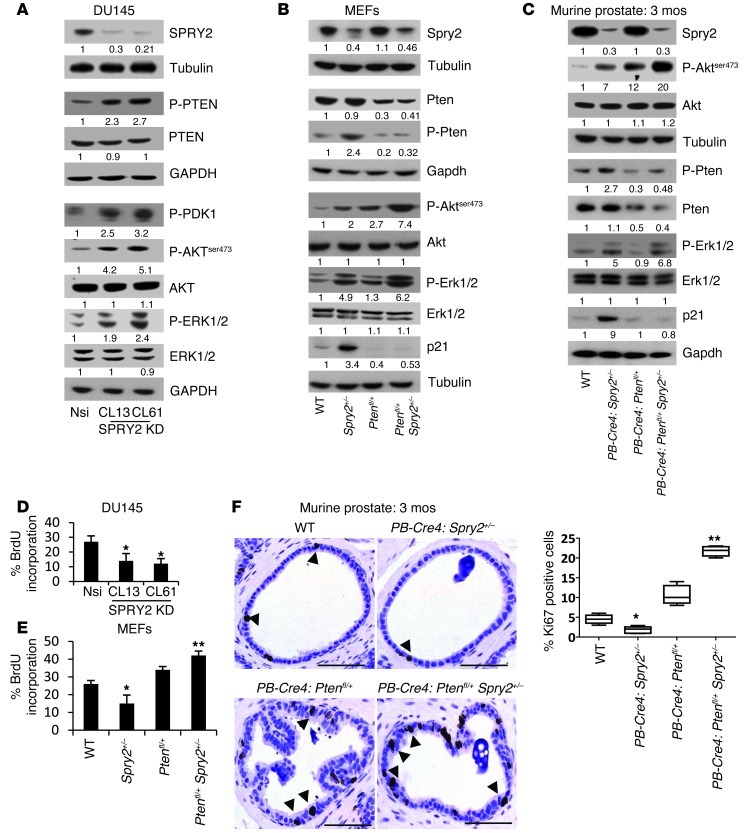
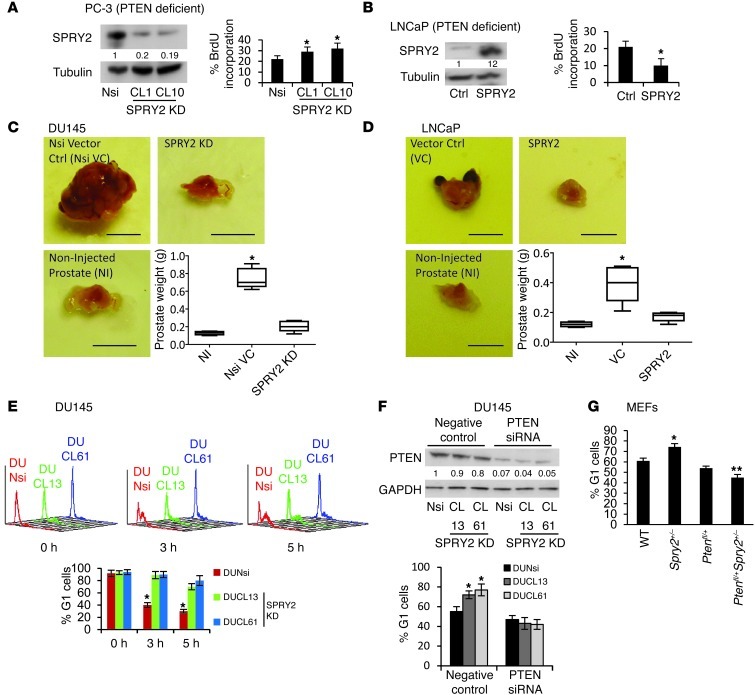
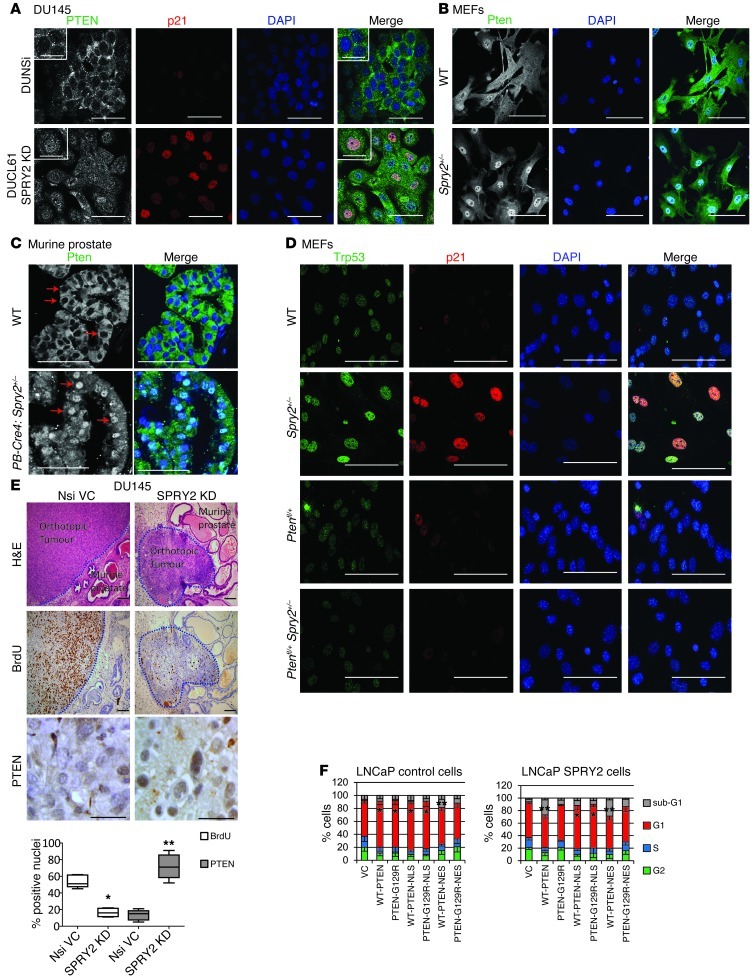
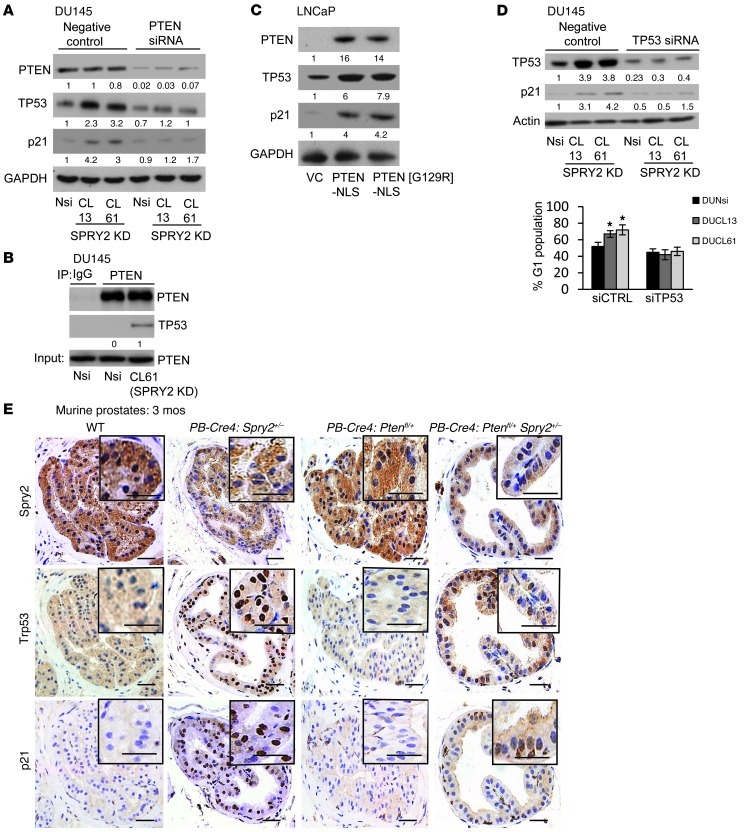
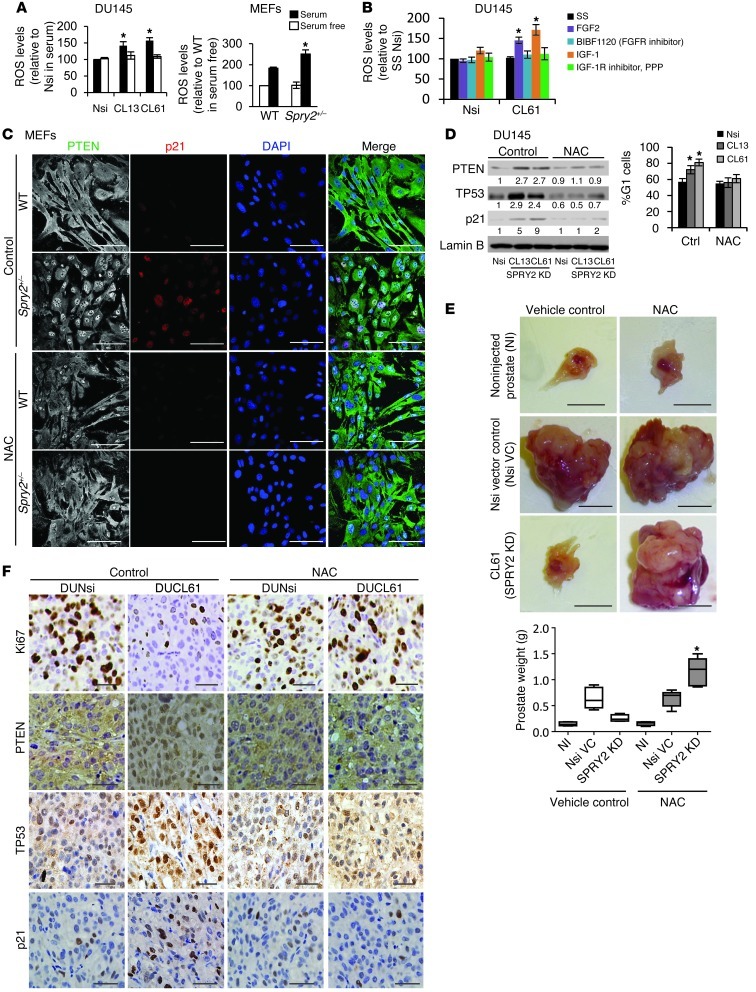
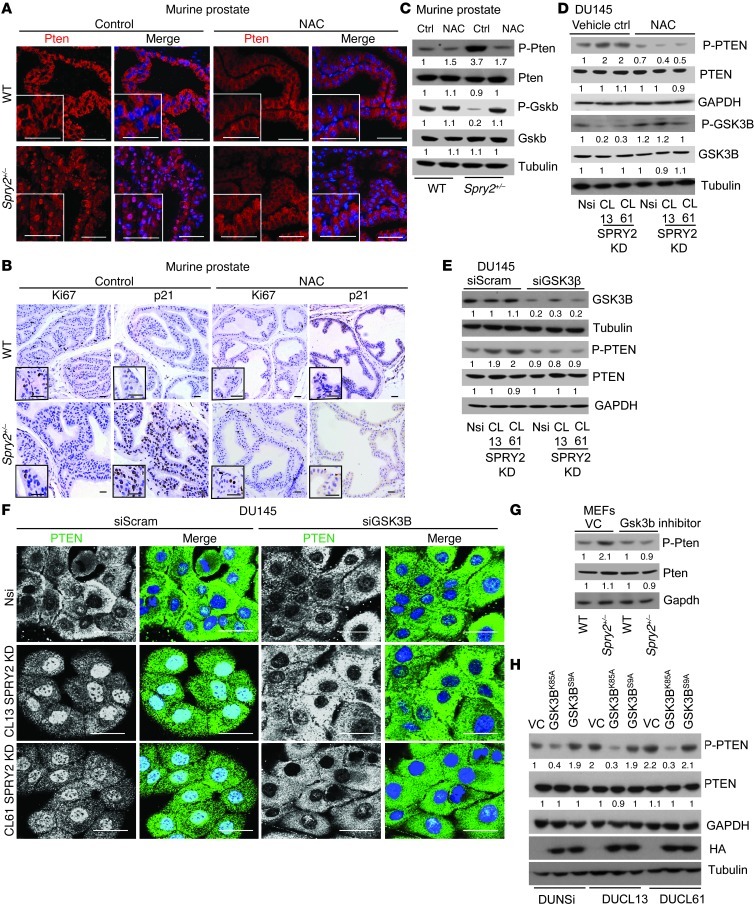
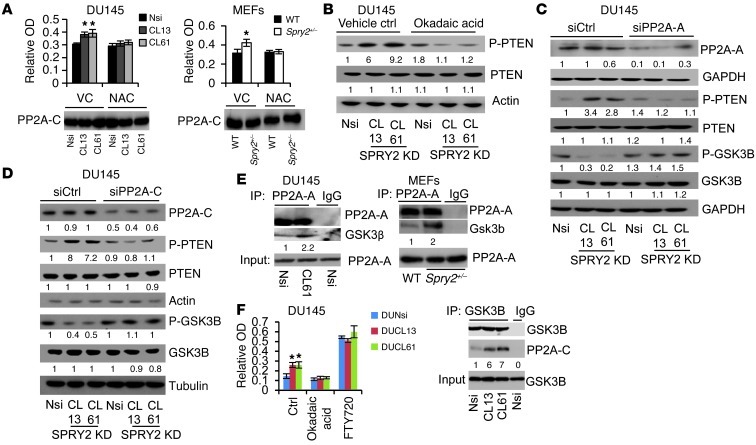
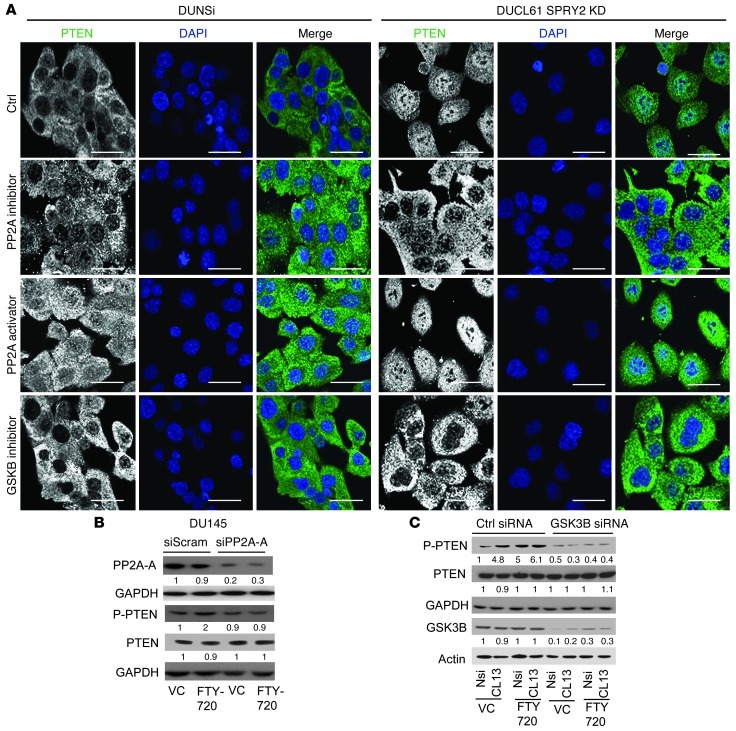
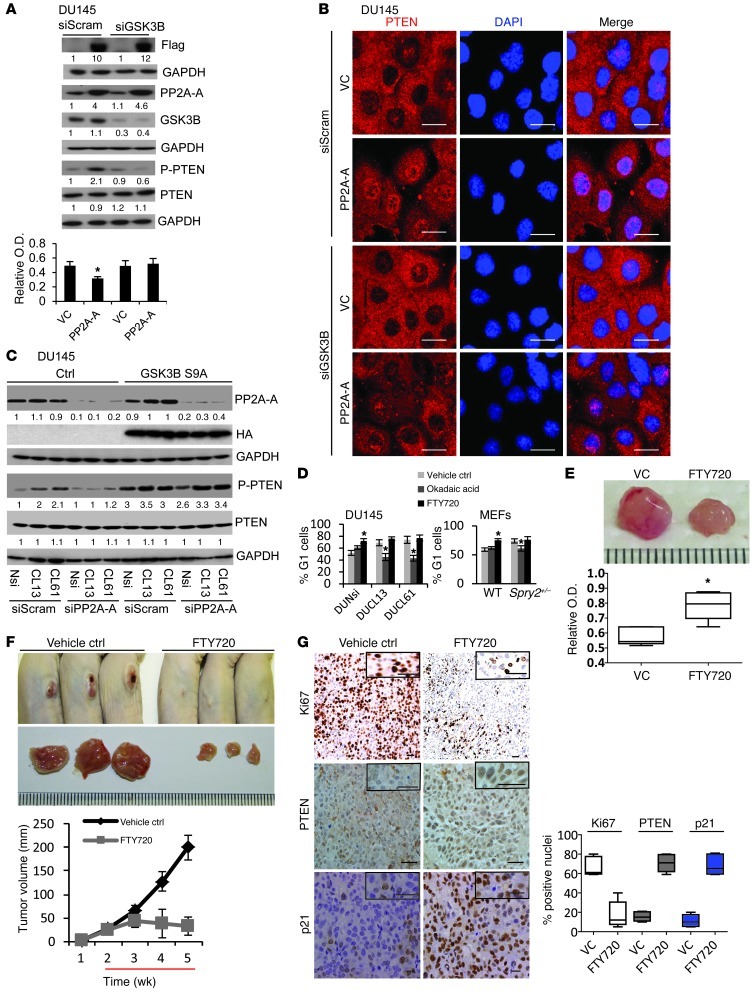
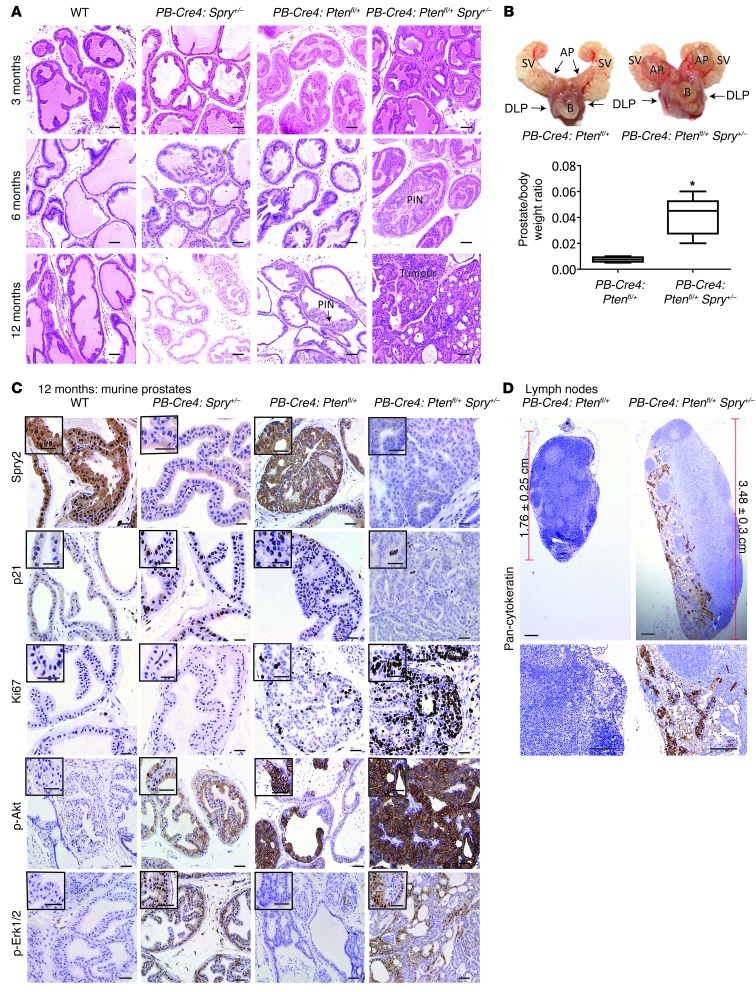
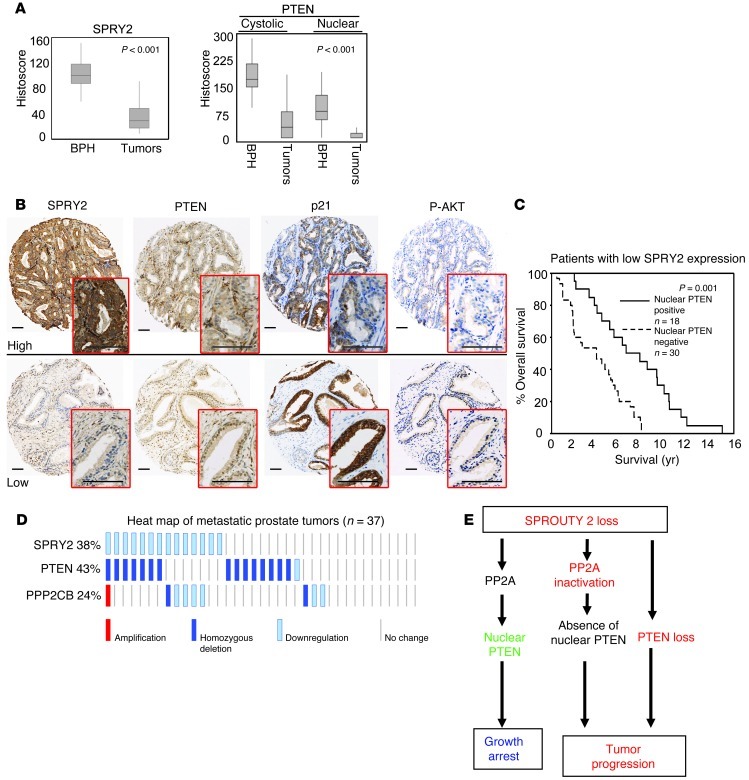
Concurrent activation of RAS/ERK and PI3K/AKT pathways is implicated in prostate cancer progression. The negative regulators of these pathways, including sprouty2 (SPRY2), protein phosphatase 2A (PP2A), and phosphatase and tensin homolog (PTEN), are commonly inactivated in prostate cancer. The molecular basis of cooperation between these genetic alterations is unknown. Here, we show that SPRY2 deficiency alone triggers activation of AKT and ERK, but this is insufficient to drive tumorigenesis. In addition to AKT and ERK activation, SPRY2 loss also activates a PP2A-dependent tumor suppressor checkpoint. Mechanistically, the PP2A-mediated growth arrest depends on GSK3β and is ultimately mediated by nuclear PTEN. In murine prostate cancer models, Pten haploinsufficiency synergized with Spry2 deficiency to drive tumorigenesis, including metastasis. Together, these results show that loss of Pten cooperates with Spry2 deficiency by bypassing a novel tumor suppressor checkpoint. Furthermore, loss of SPRY2 expression correlates strongly with loss of PTEN and/or PP2A subunits in human prostate cancer. This underlines the cooperation between SPRY2 deficiency and PTEN or PP2A inactivation in promoting tumorigenesis. Overall, we propose SPRY2, PTEN, and PP2A status as an important determinant of prostate cancer progression. Characterization of this trio may facilitate patient stratification for targeted therapies and chemopreventive interventions.


Figures

Figure 1
Figure 1. SPRY2 KD decreases cell proliferation despite activation of mitogenic signaling.
(A) Whole cell lysates (WCL) of Nsi VC and SPRY2 KD DU145 clones were analyzed by Western blot (WB). (B and C) WCLs of (B) MEFs and (C) prostatic tissue from mice as indicated were analyzed by Western blot (n = 3). (D and E) BrdU incorporation analysis on (D) DU145 and (E) MEFs with indicated genetic alterations (*P < 0.001, **P < 0.05; n = 3; analyzed by Mann-Whitney test). Data are presented as mean ± SEM. (F) Representative IHC images and quantification for Ki67 staining in prostates of indicated mice. Scale bars: 100 μm. Arrows indicate Ki67-positive nuclei. (*P < 0.01, **P < 0.001; number of mice analyzed = 5 analyzed by Dunnett’s multiple comparison test). Box and whisker plots show median (lines within boxes), interquartile range (bounds of boxes), and upper and lower range (whiskers). All the Western blots were quantified using ImageJ, and the values represent relative immunoreactivity of each protein normalized to respective loading control.
Figure 2
Figure 2. SPRY2 loss induces PTEN-mediated G1 arrest.
(A and B) Western blot and BrdU incorporation analysis on (A) PC3 and (B) LNCaP cells (*P < 0.001; n = 3, analyzed by Mann-Whitney test). (C and D) Representative orthotopic tumor images and the weights of prostate following injection with (C) DU145 and (D) LNCaP cells as indicated. (*P < 0.01, number of mice = 5, analyzed by Dunnett’s multiple comparison test). Scale bars: 0.5 cm. Box and whisker plots show median (lines within boxes), interquartile range (bounds of boxes), and upper and lower range (whiskers). (E) SPRY2 KD DU145 were analyzed for cell-cycle profiles (top panel) after thymidine block release, and percentage of G1 cells are in bar chart (bottom panel; *P < 0.01; n = 3, analyzed by Mann-Whitney test). (F) SPRY2 KD DU145 transfected with PTEN siRNA were analyzed by Western blot and the G1 cells quantified. (*P < 0.01; n = 3, analyzed by Mann-Whitney test). (G) MEFs as indicated were quantified for cells in G1 (*P < 0.001; **P < 0.01; n = 3, analyzed by Mann-Whitney test). All Western blots were quantified using ImageJ, and the values represent relative immunoreactivity of each protein normalized to respective loading control. Data (A, B, F, and G) presented as mean ± SEM.
Figure 3
Figure 3. SPRY2 loss–induced G1 arrest is mediated by nuclear accumulation of PTEN.
(A) Representative immunofluorescence (IF) images of indicated DU145 cells stained for PTEN (green), p21 (red), and DAPI (blue) (n = 3). Scale bars: 50 μm. (B and C) Representative immunofluorescence images of WT and Spry2+/– (B) MEFs and (C) prostate tissue stained for Pten (green). Red arrows indicate selected nuclei positive for Pten (n = 5). Scale bars: 100 μm. (D) Representative immunofluorescence images of indicated MEFs stained for Trp53 (green), p21 (red), and DAPI (blue). Scale bars: 100 μm. (E) Representative images and quantitation of DU145 orthotopic tumors stained for H&E, BrdU, and PTEN (*P < 0.01 **P < 0.001; n = 5, analyzed by Mann-Whitney test). Scale bars: 100 μm. Box and whisker plots show median (lines within boxes), interquartile range (bounds of boxes), and upper and lower range (whiskers). (F) SPRY2-LNCaP cells transfected with indicated plasmids were analyzed for cell-cycle profile after 24 hours (*P < 0.01; **P < 0.05 n = 3, analyzed by Mann-Whitney test). Data are presented as mean ± SEM.
Figure 4
Figure 4. SPRY2 deficiency induces TP53-dependent G1 arrest via nuclear PTEN.
(A) Western blot analysis of indicated DU145 cells transfected with PTEN siRNA. (B) Western blot analysis of PTEN IP from DU145. (C) Western blot analysis for LNCaP cells transfected with indicated plasmids. (D) DU145 cells transfected with TP53 siRNA were analyzed by Western blot and quantified for cells in G1. (*P < 0.01; n = 3, analyzed by Mann-Whitney test). Data are presented as mean ± SEM. (E) Representative IHC images for Srpy2, Trp53, and p21 in prostates of mice as indicated (n = 4). Scale bars: 50 μm. All Western blots were quantified using ImageJ, and the values represent relative immunoreactivity of each protein normalized to respective loading control.
Figure 5
Figure 5. SPRY2 deficiency–induced ROS increases nuclear accumulation of PTEN.
(A) DU145 and MEFs were analyzed for intracellular ROS using DCFDA dye in the presence and absence of 10% serum (*P < 0.01; n = 3, analyzed by Mann-Whitney test). (B) Intracellular ROS was detected using DCFDA dye and analyzed in 24-hour serum-starved DU145 cells following treatment with growth factors (FGF2 [10 ng/ml], IGF-1 [100 ng/ml]) along with respective inhibitors (FGFR inhibitor- BIBF1120 [0.4 μM], IGF-1R inhibitor, PPP [2 nM]) for 30 minutes. SS, serum starved. (*P < 0.01; n = 3, analyzed by Mann-Whitney test). (C) Representative immunofluorescence images of MEFs stained for Pten (green) and p21 (red) after 5 μM NAC treatment for 48 hours. Scale bars: 100 μm. (D) Nuclear extracts from DU145 cells treated with 5 μM NAC for 48 hours were analyzed by Western blot, and G1 cells were quantified (*P < 0.001; n = 3, analyzed by Mann-Whitney test). (E) Representative images and prostate weights of nude mice orthotopically injected with Nsi or SPRY2 KD (CL61) DU145 cells and treated with NAC. Scale bars: 0.5 cm. (*P < 0.01, number of mice = 7, analyzed by Dunnett’s multiple comparison test). Box and whisker plots show median (lines within boxes), interquartile range (bounds of boxes), and upper and lower range (whiskers). (F) Representative images of IHC for Ki67, PTEN, TP53, and p21 in indicated DU145 orthotopic tumors. Scale bars: 100 μm. All the Western blots were quantified using ImageJ, and the values represent relative immunoreactivity of each protein normalized to respective loading control. Data are presented as mean ± SEM (A, B, and D).
Figure 6
Figure 6. GSK3B activation drives phosphorylation and nuclear accumulation of PTEN.
(A and B) Representative images of (A) PTEN (red) immunofluorescence and of (B) Ki67 and p21 IHC on prostate tissue from WT and Spry2+/– mice treated with 10 mM NAC for 75 days in drinking water ad libitum. Scale bars: 50 μm. (C) Western blot analysis of WCL from prostates of indicated mice treated with 10 mM NAC for 75 days in drinking water ad libitum. (D) Western blot analysis of indicated DU145 cells treated with 10 μM NAC for 12 hours. (E) Western blot analysis of DU145 cells treated with GSK3B siRNA. (F) Representative PTEN immunofluorescence images of DU145 cells treated with GSK3B siRNA. Scale bars: 50 μm. (G) Western blot analysis of indicated MEFs treated with Gsk3b inhibitor SB216763 (5 μM for 12 hours). (H) Western blot analysis of DU145 SPRY2 KD clones with stable expression of kinase dead (GSK3BK85A) and constitutively active (GSK3BS9A) GSK3B. All the Western blots were quantified using ImageJ, and the values represent relative immunoreactivity of each protein normalized to respective loading control.
Figure 7
Figure 7. ROS-mediated PP2A activation increases phosphorylation of PTEN.
(A) PP2A activity was measured in DU145 and MEFs (*P < 0.05, analyzed by Mann-Whitney test), and PP2A-C IP was analyzed by Western blot. (BD) Western blot analysis of indicated DU145 cells treated with (B) 1 μM okadaic acid for 2 hours, (C) 5 nmol PP2A-A siRNA for 42 hours, and (D) 5 nmol PP2A-C siRNA for 42 hours. (E) PP2A-A IP from DU145 and MEFs was analyzed by Western blot. (F) PP2A activity and Western blot of GSK3B IP in DU145 cells treated with 1 μM okadaic acid and 10 μM FTY720 for 2 hours (*P < 0.05, n = 3, analyzed by Mann-Whitney test). All Western blots were quantified using ImageJ, and the values represent relative immunoreactivity of each protein normalized to respective loading control. Data are presented as mean ± SEM (A and F).
Figure 8
Figure 8. PP2A activation drives PTEN phosphorylation and nuclear localization via GSK3B.
(A) Representative immunofluorescence images of okadaic acid–treated (0.5 μM for 1 hour), FTY720-treated (10 μM for 6 hours) and SB216763-treated (5 μM for 12 hours) DU145 cells stained for PTEN (green). Scale bars: 50 μm. (B) Western blot analysis of DU145 cells treated with 5 nmol PP2A-A siRNA for 24 hours followed by 5 μM FTY720 for 12 hours as indicated. (C) Western blot analysis of DU145 cells treated with GSK3B siRNA for 24 hours followed by 5 μM FTY720 for 12 hours. All Western blots were quantified using ImageJ, and the values represent relative immunoreactivity of each protein normalized to respective loading control.
Figure 9
Figure 9. PP2A activation suppresses tumorigenesis by increasing nuclear localization of PTEN.
(A) DU145 cells infected with control and PP2A-A–expressing viruses were treated with GSK3B siRNA for 24 hours and analyzed by Western blot and WST-1 assay for measuring cell proliferation (*P < 0.01; n = 3). (B) Representative immunofluorescence images of PP2A-A–expressing DU145 cells treated with GSK3B siRNA for 24 hours and stained for PTEN. Scale bars: 50 μm. (C) Western blot analysis of DU145 SPRY2 KD clones with stable expression of constitutively active GSK3B (S9A) treated with 5 nmol PP2A-A siRNA for 42 hours. (D) DU145 and MEF cells treated with 0.2 μM okadaic acid or 10 μM FTY720 for 12 hours were quantified for percentage of G1 cells (*P < 0.01; n = 3). (E) Representative images and PP2A activity measurement in s.c. xenografts of DU145 cells in nude mice treated with PP2A activator FTY720 (10 mg/kg/d i.p. injection) for 5 days. (*P < 0.01; n = 5). (F) Representative images and tumor burden of s.c. injected DU145 cells in nude mice treated as indicated. Red line indicates schedule of FTY720 treatment (10 mg/kg/d i.p. injection). (G) Representative IHC images and quantification of Ki67 (white), PTEN (gray), and p21 (blue) in DU145 s.c. xenografts treated as above. Scale bars: 50 μm. Box and whisker plots (E and G) show median (lines within boxes), interquartile range (bounds of boxes), and upper and lower range (whiskers). The values of Western blot represent relative immunoreactivity of each protein normalized to respective loading control. Data are presented as mean ± SEM and analyzed by Mann-Whitney test (A and DF).
Figure 10
Figure 10. Spry2 and Pten inactivation synergistically drive murine prostate carcinogenesis.
(A) Representative H&E-stained images of alterations in prostates from mice as indicated (n = 6). Scale bars: 50 μm. (B) Representative prostate image and relative prostate weight of indicated mice at 12 months (*P < 0.01, n = 6, analyzed by Mann-Whitney Test). SV, seminal vesicles; AP, anterior prostate, DLP, dorsolateral prostate; B, bladder. Box and whisker plot shows median (lines within boxes), interquartile range (bounds of boxes), and upper and lower range (whiskers). (C) Representative IHC images of prostate tissue from 12-month-old mice as indicated (n = 6). Scale bars: 50 μm. (D) Representative IHC images for pancytokeratin staining in lymph nodes from indicated mice (n = 5). Scale bars: 50 μm.
Figure 11
Figure 11. Impact of SPRY2, PTEN, and PP2A status in clinical PC.
(A) TMA of clinical PC and BPH cohorts was analyzed for expression of SPRY2 and nuclear and cytoplasmic PTEN. Box and whisker plots show median (lines within boxes), interquartile range (bounds of boxes), and upper and lower range (whiskers). Data were analyzed by ANOVA using Dunnett’s multiple comparison test. (B) Representative IHC images in clinical BPH samples. Scale bars: 100 μm. (C) Kaplan-Meier survival plot for PC patients with reduced SPRY2 expression (below median histoscore); analysis was according to the levels of nuclear PTEN. (D) Heat map of alterations in SPRY2, PTEN, and PPP2CB (PP2A catalytic subunit) generated from metastatic tumors (27 cases) using MSKCC Prostate Oncogenome Project data set from cBio genomic portal. (E) Schematic of PC progression. SPRY2 loss leads to tumor suppression by inducing growth arrest via PP2A-mediated nuclear accumulation of PTEN. Subsequent inactivation of PTEN or PP2A as observed in clinical PC may drive tumor progression.

References

    1. Yap TA, Zivi A, Omlin A, de Bono JS. The changing therapeutic landscape of castration-resistant prostate cancer. Nat Rev Clin Oncol. 2011;8(10):597–610. doi: 10.1038/nrclinonc.2011.117. - DOI - PubMed
    1. Taylor BS, et al. Integrative genomic profiling of human prostate cancer. Cancer Cell. 2010;18(1):11–22. doi: 10.1016/j.ccr.2010.05.026. - DOI - PMC - PubMed
    1. Kennedy AL, et al. Activation of the PIK3CA/AKT pathway suppresses senescence induced by an activated RAS oncogene to promote tumourigenesis. Mol Cell. 2011;42(1):36–49. doi: 10.1016/j.molcel.2011.02.020. - DOI - PMC - PubMed
    1. Ahmad I, et al. HER2 overcomes PTEN (loss)-induced senescence to cause aggressive prostate cancer. Proc Natl Acad Sci U S A. 2011;108(39):16392–16397. doi: 10.1073/pnas.1101263108. - DOI - PMC - PubMed
    1. McKie AB, et al. Epigenetic inactivation of the human sprouty2 (hSPRY2) homologue in prostate cancer. Oncogene. 2005;24(13):2166–2174. doi: 10.1038/sj.onc.1208371. - DOI - PubMed

Publication types

MeSH terms