. 2013 Mar;15(3):302-8.
doi: 10.1038/ncb2696. Epub 2013 Feb 24.

Characterization of the adipocyte cellular lineage in vivo

Affiliations

Characterization of the adipocyte cellular lineage in vivo

Ryan Berry et al. Nat Cell Biol. 2013 Mar.

Abstract

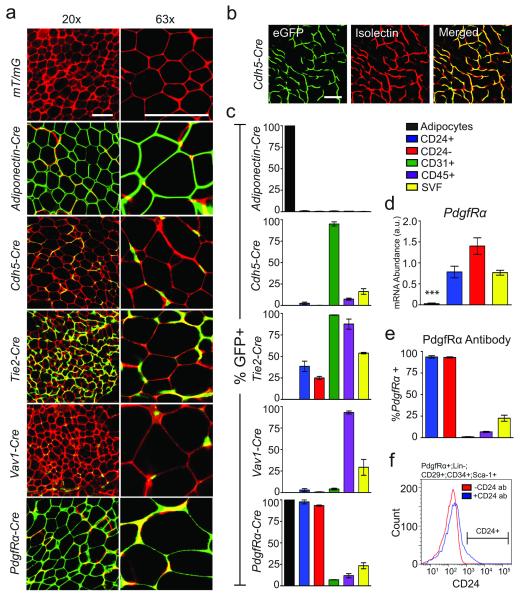
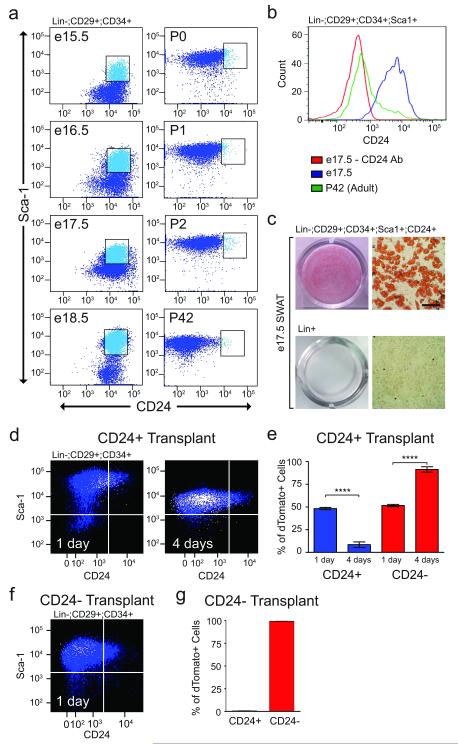
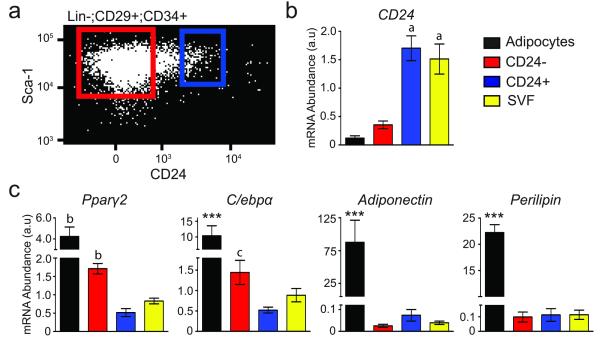
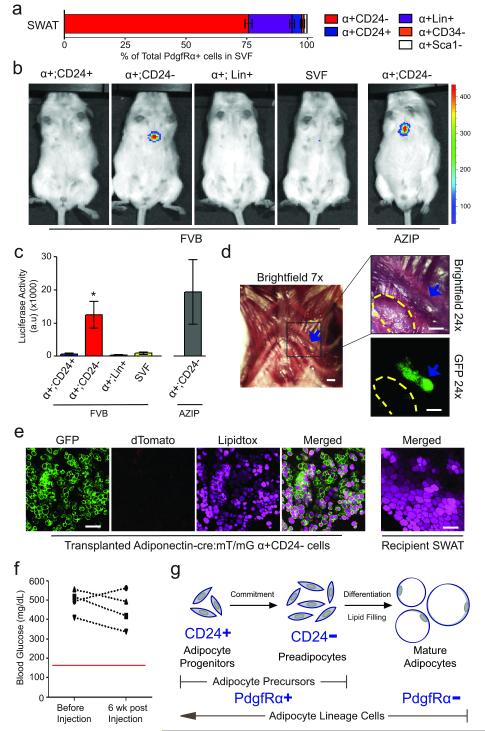
Mature adipocytes are generated through the proliferation and differentiation of precursor cells. Our previous studies identified adipocyte progenitors in white adipose tissue (WAT) as Lin(-):CD29(+):CD34(+):Sca-1(+):CD24(+) (CD24(+)) cells that are capable of generating functional WAT (ref. ). Here, we employ several Cre recombinase mouse models to identify the adipocyte cellular lineage in vivo. Although it has been proposed that white adipocytes are derived from endothelial and haematopoietic lineages, we find that neither of these lineages label white adipocytes. However, platelet-derived growth factor receptor α (PdgfRα)-Cre trace labels all white adipocytes. Analysis of WAT from PdgfRα-Cre reporter mice identifies CD24(+) and Lin(-):CD29(+):CD34(+):Sca-1(+): CD24(-) (CD24(-)) cells as adipocyte precursors. We show that CD24(+) cells generate the CD24(-) population in vivo and the CD24(-) cells express late markers of adipogenesis. From these data we propose a model where the CD24(+) adipocyte progenitors become further committed to the adipocyte lineage as CD24 expression is lost, generating CD24(-) preadipocytes. This characterization of the adipocyte cellular lineage will facilitate the study of the mechanisms that regulate WAT formation in vivo and WAT mass expansion in obesity.


Figures

Figure 1
Figure 1
Adipocytes are derived from PdgfRα+ precursor cells in subcutaneous WAT. (a) Confocal images of whole-mounted SWAT from indicated 4-week old Cre:mT/mG male mice (red: membrane-targeted dTomato; green: membrane-targeted eGFP, indicating Cre excision of dTomato). (b) Confocal images of membrane targeted eGFP and Isolectin GS-IB4 Alexa Fluor 647 staining endothelial cells of Cdh5-Cre:mT/mG SWAT. (c) Quantification of flow cytometry analysis of SVF populations from indicated 4-week old Cre:mT/mG mice (n=3). (d) Quantification of qPCR analysis of PdgfRα in mature adipocytes and FACS sorted SVF, Lin−:CD29+:CD34+:Sca-1+:CD24+ (CD24+) and Lin−:CD29+:CD34+:Sca-1+:CD24− (CD24−) cell populations (n=5 RNA extractions from independently isolated cell samples, *** p<0.001). (e) Quantification of flow cytometry analysis of anti-PdgfRα-PE antibody staining in indicated cell populations from 6-week old male C57BL/6 SWAT (n=3 SWAT SVF preparations). (f) A histogram of the distribution of CD24 staining in PdgfRα+:Lin−:CD29+:CD34+:Sca-1+ cells from (e). All error bars represent S.E.M. All scale bars represent 100 μm.
Figure 2
Figure 2
CD24+ adipocyte progenitors give rise to CD24− cells in vivo. (a) Flow cytometry plots of SVF from a time course SWAT development in C57BL/6 mice at the indicated embryonic (e) and post-natal (P) days. Dot plots show Lin−:CD29+:CD34+ cells. (b) CD24 staining in Lin−:CD29+:CD34+:Sca1+ cells from e17.5 and P42 SWAT. (c) Oil Red O staining of differentiated FACS sorted cell populations from e17.5 SWAT. Scale bar represents 100 μm. (d) Representative images of flow cytometry plots of SWAT Lin−:CD29+:CD34+ cells from 6-week old Rag2-/-;IL2Rγ-/-;A-Zip mice at indicated days post transplantation of 100,000 FACS-isolated dTomato+, Lin−:CD29+:CD34+:Sca-1+:CD24+ (CD24+) cells from 6-week old mT/mG mice. Plots show overlay of dTomato+ transplanted cells (white) on Rag2-/-;IL2Rγ-/-;A-Zip recipient SVF cells (blue). (e) Quantification of flow cytometry analysis of dTomato+ CD24+ transplantations into Rag2-/-;IL2Rγ-/-;A-Zip mice (n=4 transplantations, **** p<0.0001, error bar represent S.E.M.). (f). Representative flow cytometry plot of SWAT Lin−:CD29+:CD34+ cells from 6-week old Rag2-/-;IL2Rγ-/-;A-Zip mice at 1 day post transplantation of 100,000 FACS isolated dTomato+, CD24− cells from 6-week old mT/mG mice. The dot plot shows overlay of dTomato+ transplanted cells (white) on Rag2-/-;IL2Rγ-/-;A-Zip recipient SVF cells (blue). (g) Quantification of flow cytometry analysis of dTomato+ CD24− transplantations into Rag2-/- ;IL2Rγ-/-;A-Zip mice (n=3 transplants, error bars represent S.E.M.).
Figure 3
Figure 3
CD24− cells express late adipogenic genes. (a) A representative dot plot is shown with boxes representing the sort parameters for the CD24+ (blue) and CD24− (red) populations. (b,c) qPCR of CD24 expression, late adipogenic and mature adipocyte specific genes in purified mature adipocytes and FACS isolated cell populations (n=5 RNA extractions from independently isolated cell samples; *** p<0.001 vs. all other populations; a p<0.001 vs. CD24− and adipocytes (Adi); b p<0.001 vs. CD24+ and SVF; c p<0.001 vs. Adi and p<0.05 vs. CD24+; error bars represent S.E.M.).
Figure 4
Figure 4
CD24− cells are further committed to an adipogenic fate. (a) Breakdown of PdgfRα+ (α+) SVF into subpopulations. Flow cytometry plots and percentages are shown in Supplemental Figure 2b. α+:CD24−, α+:CD24+, and α+:Sca1− are Lin−:CD29+:CD34+. α+:CD34− are Lin−:CD29+. (b) Luminescence in 12-week old FVBN/J or A-Zip mice at 6 weeks post subcutaneous sternum transplantation of indicated FACS isolated populations from 6-week old leptin-luciferase BAC transgenic mice. 50,000 cells were transplanted per experiment. (c) Quantification of luminescence from (b) (n=5 for α+:CD24+ and α+:Lin+ transplants into FVB; n=10 for α+:CD24− and SVF transplants into FVB; n=4 for α+:CD24− transplants into AZIP. *p<.05, error bars represent S.E.M.). (d) Brightfield and fluorescent images of tissue formed 6 weeks post subcutaneous sternum transplantation of 2×10⁵ Adiponectin-Cre:mT/mG α+:CD24− cells. Blue arrow indicates tissue formed from transplanted cells. Yellow dashes outline a small piece of recipient SWAT placed on top of sternum as a negative imaging control. Scale bars represent 1 mm. (e) Representative confocal images of Lipidtox stained tissues from (d). Scale bars represent 100 μm. (f) Blood glucose measurement of A-Zip mice before and 6 weeks post subcutaneous sternum transplantation of 50,000 α+CD24− as shown in (b) and (c). (g) A model of in vivo adipogenesis.

References

    1. Rodeheffer MS, Birsoy K, Friedman JM. Identification of white adipocyte progenitor cells in vivo. Cell. 2008;135:240–249. - PubMed
    1. Tran KV, et al. The vascular endothelium of the adipose tissue gives rise to both white and brown fat cells. Cell Metab. 2012;15:222–229. - PMC - PubMed
    1. Crossno JT, Majka SM, Grazia T, Gill RG, Klemm DJ. Rosiglitazone promotes development of a novel adipocyte population from bone marrow-derived circulating progenitor cells. J Clin Invest. 2006;116:3220–3228. - PMC - PubMed
    1. Sera Y, et al. Hematopoietic stem cell origin of adipocytes. Exp Hematol. 2009;37:1108–1120. 1120.e1101–1104. - PMC - PubMed
    1. Spalding KL, et al. Dynamics of fat cell turnover in humans. Nature. 2008;453:783–787. - PubMed

Publication types

MeSH terms