

Rapid characterization of vegetation structure with a Microsoft Kinect sensor
- PMID: 23435053
- PMCID: PMC3649362
- DOI: 10.3390/s130202384
Rapid characterization of vegetation structure with a Microsoft Kinect sensor
Abstract
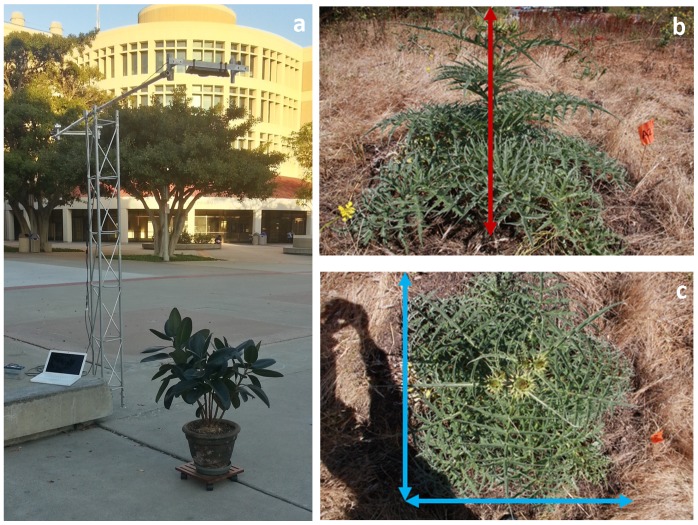
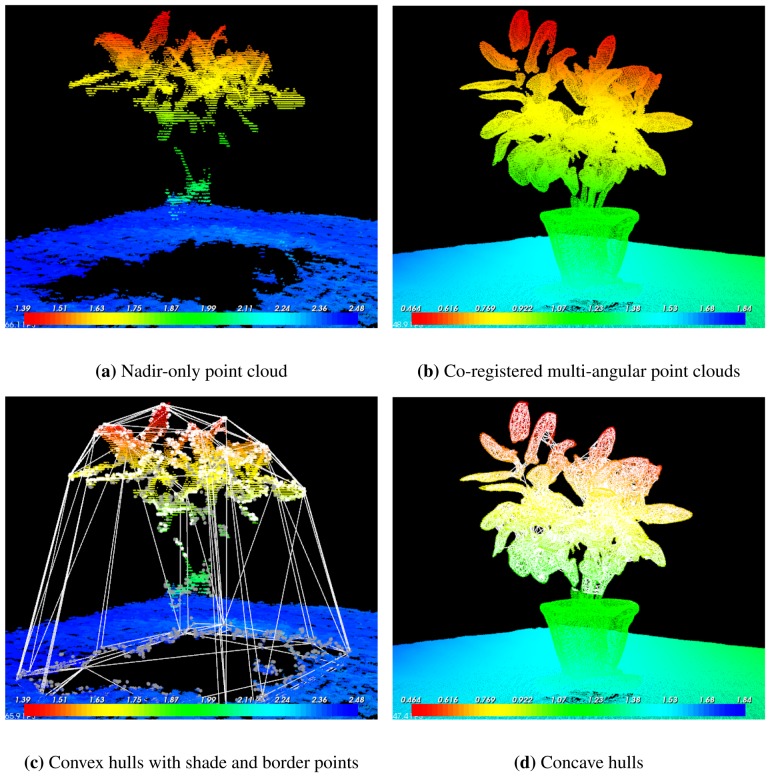
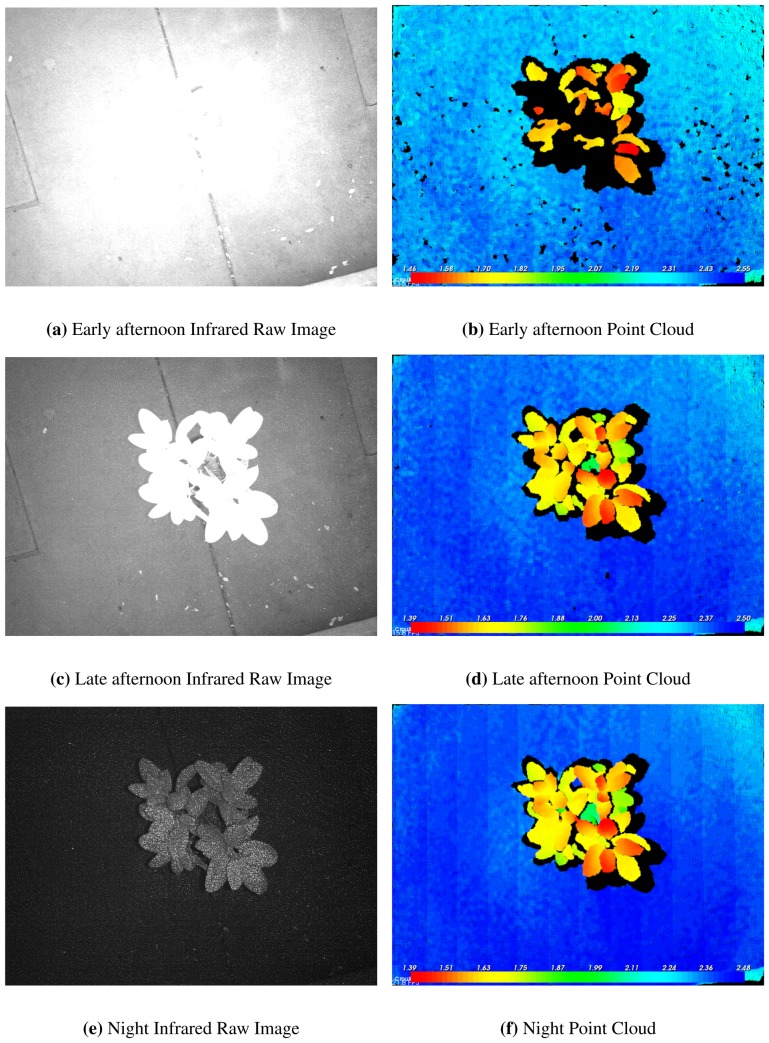
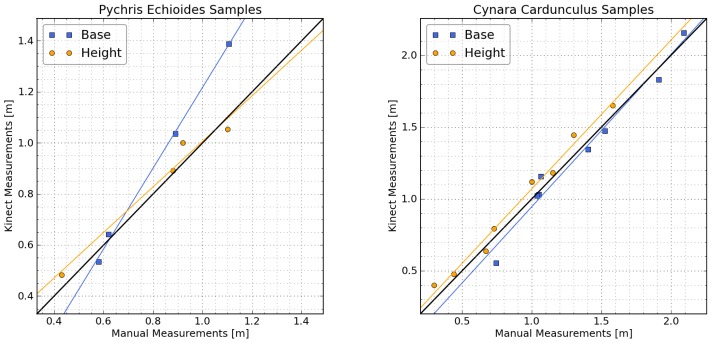
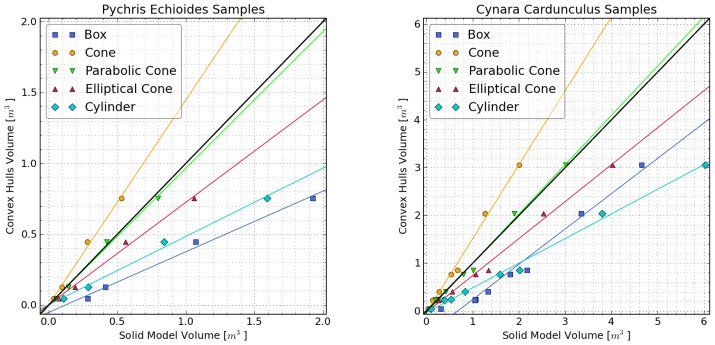
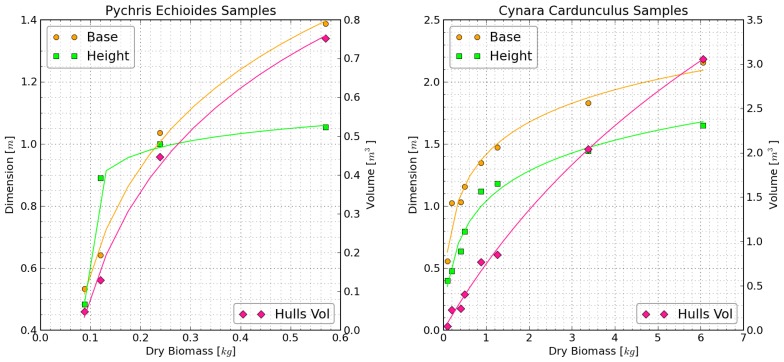
The importance of vegetation structure and biomass in controlling land-atmosphere exchange is widely recognized, but measurements of canopy structure are challenging, time consuming, and often rely on destructive methods. The Microsoft Kinect is an infrared sensor designed for video gaming that outputs synchronized color and depth images and that has the potential to allow rapid characterization of vegetation structure. We compared depth images from a Kinect sensor with manual measurements of plant structure and size for two species growing in a California grassland. The depth images agreed well with the horizontal and vertical measurements of plant size made manually. Similarly, the plant volumes calculated with a three-dimensional convex hulls approach was well related to plant biomass. The Kinect showed some limitations for ecological observation associated with a short measurement range and daytime light contamination. Nonetheless, the Kinect's light weight, fast acquisition time, low power requirement, and cost make it a promising tool for rapid field surveys of canopy structure, especially in small-statured vegetation.
Figures
References
-
- Brunner A. A light model for spatially explicit forest stand models. Forest Ecol. Manage. 1998;107:19–46.
-
- Pielke R.A.I., Avissar R. Influence of landscape structure on local and regional climate. Landscape Ecol. 1990;4:133–155.
-
- Rotenberg E., Yakir D. Distinct patterns of changes in surface energy budget associated with forestation in the semiarid region. Glob. Change Biol. 2011;17:1536–1548.
-
- Lee X., Goulden M.L., Hollinger D.Y., Barr A., Black T.A., Bohrer G., Bracho R., Drake B., Goldstein A., Gu L., et al. Observed increase in local cooling effect of deforestation at higher latitudes. Nature. 2011;479:384–387. - PubMed
-
- Bonan G.B. Forests and climate change: Forcings, feedbacks, and the climate benefits of forests. Science. 2008;320:1444–1449. - PubMed
Publication types
MeSH terms
LinkOut - more resources
Full Text Sources
Other Literature Sources
