. 2013 Apr 1;12(7):1058-70.
doi: 10.4161/cc.24050. Epub 2013 Feb 22.

Genome-wide methylation profiling and the PI3K-AKT pathway analysis associated with smoking in urothelial cell carcinoma

Affiliations

Genome-wide methylation profiling and the PI3K-AKT pathway analysis associated with smoking in urothelial cell carcinoma

Mariana Brait et al. Cell Cycle. .

Abstract

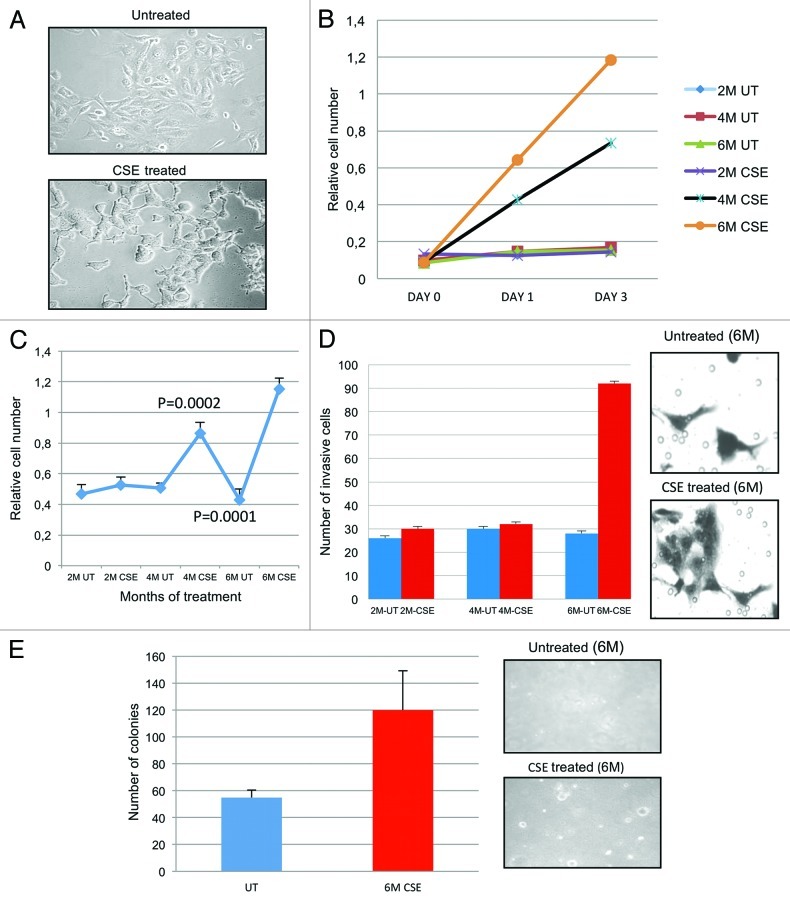
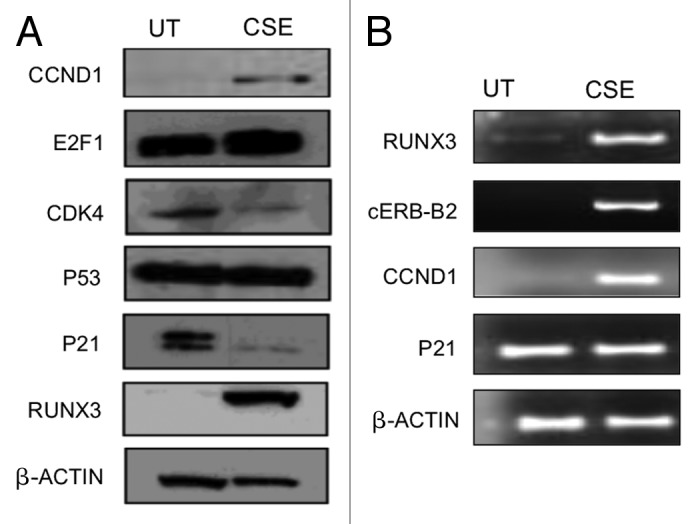
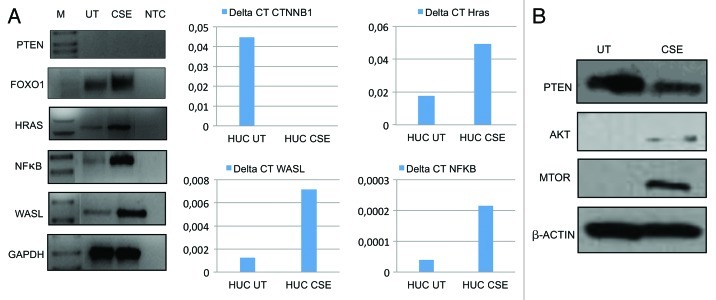
Urothelial cell carcinoma (UCC) is the second most common genitourinary malignant disease in the USA, and tobacco smoking is the major known risk factor for UCC development. Exposure to carcinogens, such as those contained in tobacco smoke, is known to directly or indirectly damage DNA, causing mutations, chromosomal deletion events and epigenetic alterations in UCC. Molecular studies have shown that chromosome 9 alterations and P53, RAS, RB and PTEN mutations are among the most frequent events in UCC. Recent studies suggested that continuous tobacco carcinogen exposure drives and enhances the selection of epigenetically altered cells in UCC, predominantly in the invasive form of the disease. However, the sequence of molecular events that leads to UCC after exposure to tobacco smoke is not well understood. To elucidate molecular events that lead to UCC oncogenesis and progression after tobacco exposure, we developed an in vitro cellular model for smoking-induced UCC. SV-40 immortalized normal HUC1 human bladder epithelial cells were continuously exposed to 0.1% cigarette smoke extract (CSE) until transformation occurred. Morphological alterations and increased cell proliferation of non-malignant urothelial cells were observed after 4 months (mo) of treatment with CSE. Anchorage-independent growth assessed by soft agar assay and increase in the migratory and invasive potential was observed in urothelial cells after 6 mo of CSE treatment. By performing a PCR mRNA expression array specific to the PI3K-AKT pathway, we found that 26 genes were upregulated and 22 genes were downregulated after 6 mo of CSE exposure of HUC1 cells. Among the altered genes, PTEN, FOXO1, MAPK1 and PDK1 were downregulated in the transformed cells, while AKT1, AKT2, HRAS, RAC1 were upregulated. Validation by RT-PCR and western blot analysis was then performed. Furthermore, genome-wide methylation analysis revealed MCAM, DCC and HIC1 are hypermethylated in CSE-treated urothelial cells when compared with non-CSE exposed cells. The methylation status of these genes was validated using quantitative methylation-specific PCR (QMSP), confirming an increase in methylation of CSE-treated urothelial cells compared to untreated controls. Therefore, our findings suggest that a tobacco signature could emerge from distinctive patterns of genetic and epigenetic alterations and can be identified using an in vitro cellular model for the development of smoking-induced cancer.

Keywords: Urothelial cell carcinoma; bladder cancer; cigarette smoke extract; epigenetics; in vitro transformation; smoking.


Figures

None
Figure 1. Biotransformation of SV40-HUC-1 cells with long-term CSE exposure. (A) Morphological changes: Morphologic differences were monitored over the entire treatment schedule, using a light microscope (20×). Cells were plated on 6-cm dishes at a density of 200,000 per plate. After 6 mo (M) of CSE treatment, HUC1 became more rounded and had a tendency to pile on to one another. The distribution of nuclear and cytoplasmic compartments was also altered. (B) MTT was performed for each month of treatment in order to determine if changes in cell proliferation occurred because of CSE treatment. This figure depicts 2, 4 and 6 mo of CSE-treated and mock-treated human immortalized normal uro-epithelial cells (HUC). The average for each sample was performed to get a standard deviation and mean value. Student’s t-test was also performed to determine the p value. All data represent +/− SD, p value < 0.05. (C) BRD-U incorporation assay shows that cells treated for 4 mo begin to show higher cell proliferation vs. controls cells. All data represent +/− SD, p value < 0.05. (D) Invasion assay: graphical representation for the invasion assays performed at months 2, 4 and 6 (left panel). All values were significant using Student’s t-test (p < 0.05). Invaded cells were counted using a light microscope at 10 different fields and a 20× objective. Pictures were taken at random. UT, untreated; M, month. Right panel shows invaded cells. (E) Soft agar assay: Anchorage-independent growth was evaluated using a soft agar assay. Cell were embedded in agar in triplicate and allowed to grow for 2 wk. Cell colonies were counted using a light microscope in four different fields and averaged. Cell colonies were then stained with 0.05% ethidium bromide for 24 h. UV transilluminator was used to determine the number of colonies per well greater than 50 μM in size. Student’s t-test was used to determine p values. Pictures were taken at random using a digital camera attached to a high resolution light microscope. Left panel shows the bar graphs of colonies of 6-mo CSE-treated and untreated SV40-HUC-1 cells. Right panel shows a photograph of the representative area (magnification, ×100). M, months; UT, untreated.
None
Figure 2. CSE induces molecular changes in SV40-HUC-1 cells that are commonly found in UCC. (A) Western blot analysis of a panel of anti-human cyclin D1, E2F1, PTEN, Cdk4, p53 and p21 antibodies used to determine the expression levels of these genes in untreated (UT) and 6-mo CSE-treated SV40-HUC-1 cells. As expected, CCND1 and E2F1 were upregulated after CSE treatment, while CDK4 and p21 were downregulated. (B) RT-PCR analysis for RUNX3, Cerb-b2, Cyclin D1, p21 expression in untreated and 6-mo CSE-treated SV40-HUC-1 cells. The transcript expression level of all four genes is consistent with their translational level (Fig. 2A).
None
Figure 3. Validation of PCR array for PI3K-AKT pathway. (A) Left panel: Expression of representative genes analyzed by semi-quantitaive RT-PCR on the SV40-HUC-1 cells untreated (UT) and exposed for 6 mo to CSE (CSE). M, molecular marker; NTC, non template control (water). GAPDH was used as an internal control. PTEN, HRAS, NFκB and WASL expression are consistent with PCR-array data while FOXO1 expression is not consistent with PCR-array data (center and right panels). Downregulation of CTNNB1 and overexpression of Hras, WASL and NFκB was observed after 6 mo CSE treatment, analyzed by real-time quantitative RT-PCR (Q-RT-PCR). Primer sequences for Q-RT-PCR are same as semi-quantitative RT-PCR and were done using SYBR green. Relative fold was calculated by the expression of target mRNA to 18S rRNA (an internal control). Experiments were performed in triplicate. Differences above a 3-fold difference were considered as significant. This result validates the finding in the AKT pathway array. (B) Western blot analysis of three AKT pathway genes: consistent with AKT pathway PCR array data, PTEN is downregulated after CSE treatment while AKT and mTOR are upregulated.
None
Figure 4. Immunohistochemistry for FOXO1. Immunohistochemistry for FOXO1 using FOXO1-specific monoclonal antibody. Representative examples of UCC samples are shown. (A) Positive staining for FOXO1 shows a cytoplasmic pattern of FOXO1 staining (magnification 10×) (B) Negative staining for FOXO1 (magnification 20×).
None
Figure 5. Methylation array. Whole-genome methylation (Illumina Infinium assay) pattern in SV40-HUC-1 cell lines treated with CSE for 6 mo and untreated controls and primary UCC samples. Genes listed on the right are showing more methylation in CSE-treated cells in comparison with CSE-untreated cells on the left. Dark colors indicate methylation.

Comment in

References

    1. Siegel R, Naishadham D, Jemal A. Cancer statistics, 2012. CA Cancer J Clin. 2012;62:10–29. doi: 10.3322/caac.20138. - DOI - PubMed
    1. Strope SA, Montie JE. The causal role of cigarette smoking in bladder cancer initiation and progression, and the role of urologists in smoking cessation. J Urol. 2008;180:31–7, discussion 37. doi: 10.1016/j.juro.2008.03.045. - DOI - PubMed
    1. Pelucchi C, Bosetti C, Negri E, Malvezzi M, La Vecchia C. Mechanisms of disease: The epidemiology of bladder cancer. Nat Clin Pract Urol. 2006;3:327–40. doi: 10.1038/ncpuro0510. - DOI - PubMed
    1. Wang YH, Yeh SD, Wu MM, Liu CT, Shen CH, Shen KH, et al. Comparing the joint effect of arsenic exposure, cigarette smoking and risk genotypes of vascular endothelial growth factor on upper urinary tract urothelial carcinoma and bladder cancer. J Hazard Mater. 2012 doi: 10.1016/j.jhazmat.2012.08.056. - DOI - PubMed
    1. Sozzi G, Pastorino U, Croce CM. MicroRNAs and lung cancer: from markers to targets. Cell Cycle. 2011;10:2045–6. doi: 10.4161/cc.10.13.15712. - DOI - PubMed

Publication types

MeSH terms