. 2013 Jul 1:74:231-44.
doi: 10.1016/j.neuroimage.2013.02.008. Epub 2013 Feb 19.

A note on the phase locking value and its properties

Affiliations

A note on the phase locking value and its properties

Sergul Aydore et al. Neuroimage. .

Abstract

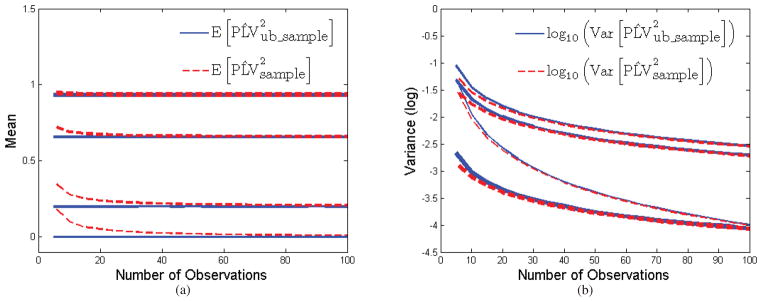
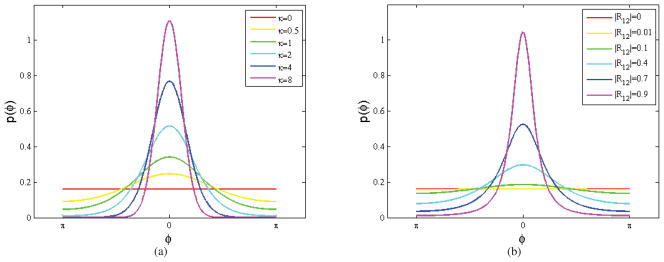
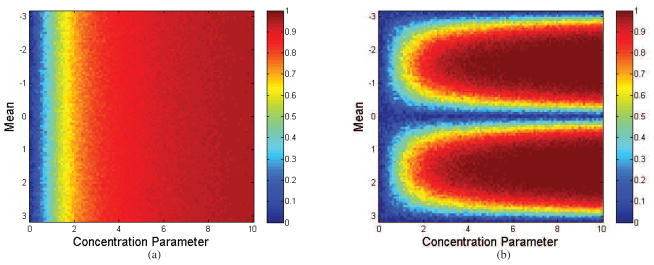
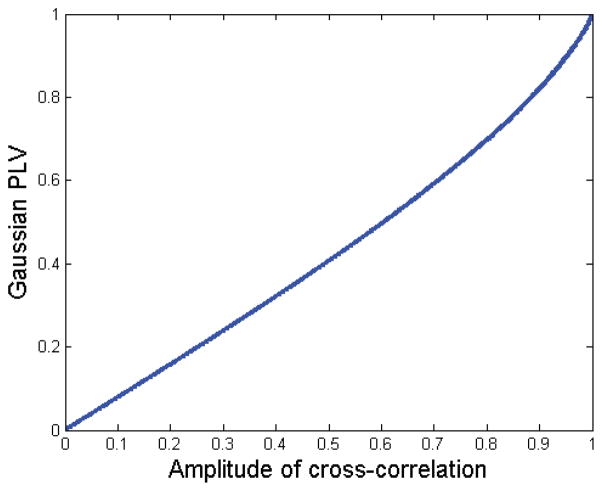
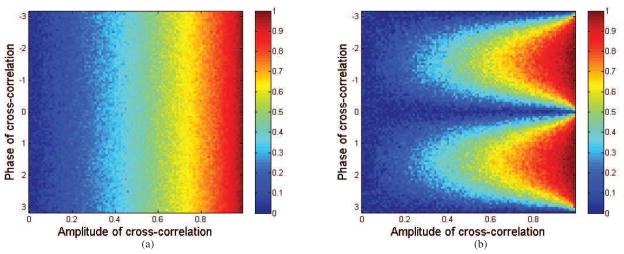
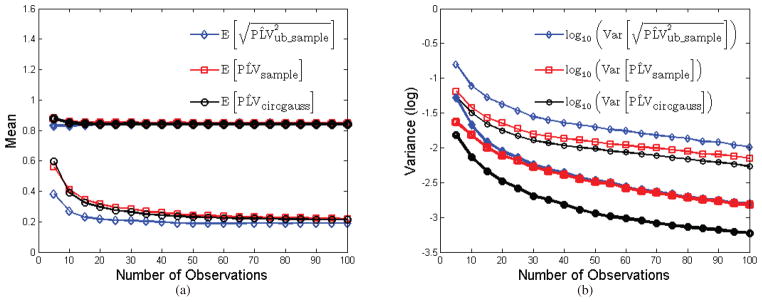
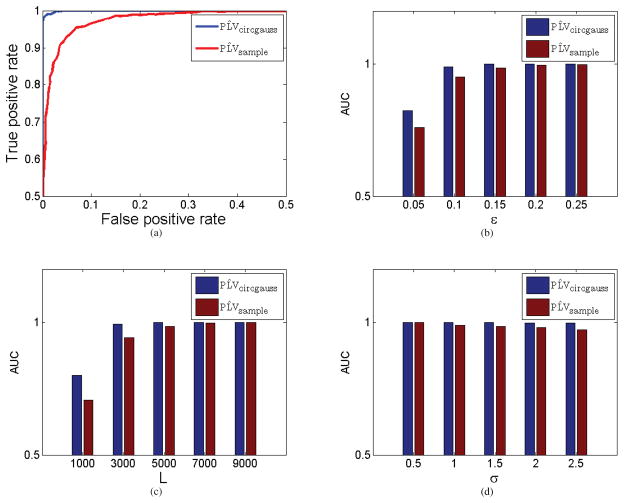
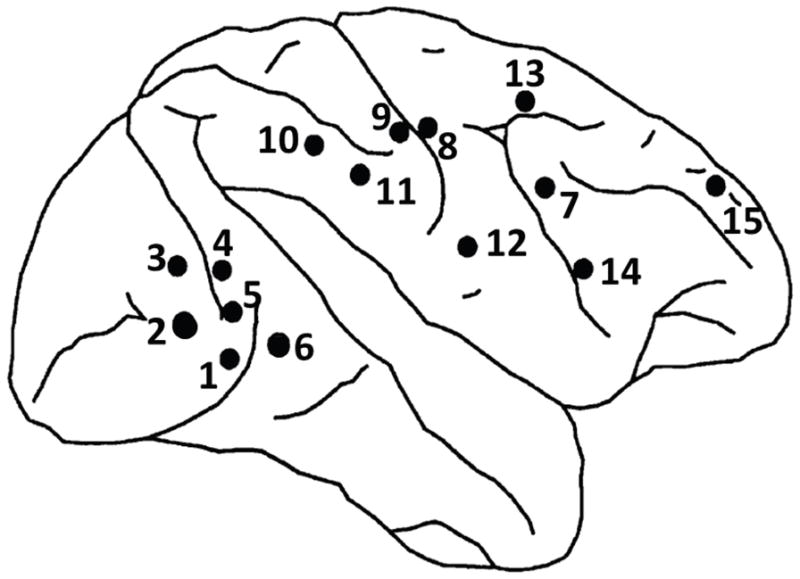
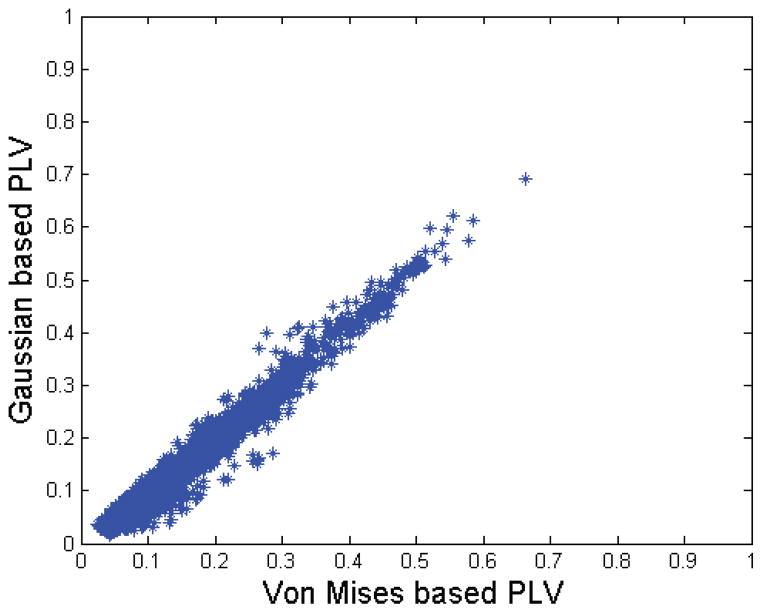
We investigate the properties of the Phase Locking Value (PLV) and the Phase Lag Index (PLI) as metrics for quantifying interactions in bivariate local field potential (LFP), electroencephalography (EEG) and magnetoencephalography (MEG) data. In particular we describe the relationship between nonparametric estimates of PLV and PLI and the parameters of two distributions that can both be used to model phase interactions. The first of these is the von Mises distribution, for which the sample PLV is a maximum likelihood estimator. The second is the relative phase distribution associated with bivariate circularly symmetric complex Gaussian data. We derive an explicit expression for the PLV for this distribution and show that it is a function of the cross-correlation between the two signals. We compare the bias and variance of the sample PLV and the PLV computed from the cross-correlation. We also show that both the von Mises and Gaussian models are suitable for representing relative phase in application to LFP data from a visually-cued motor study in macaque. We then compare results using the two different PLV estimators and conclude that, for this data, the sample PLV provides equivalent information to the cross-correlation of the two complex time series.


Figures

Figure 1
Figure 1
Bias and variance of PLV^sample2 (red) and PLV^ub_sample2 (blue) as a function of N, the number of samples used to compute the estimators: (a) mean value vs N for four different true values of PLV; (b) variance vs. N for the same true values of PLV. Samples were drawn independently from the von Mises distribution for four different concentration parameter values.
Figure 2
Figure 2
Probability density functions: (a) von Mises distribution with mean μ = 0 for a range of concentration values, κ; (b) relative phase distribution for bivariate circularly symmetric Gaussian models for different values of cross-correlation magnitude |R12|=κ12κ11κ22 with phase μ12 = 0.
Figure 3
Figure 3
Plots of sample (a) PLV and (b) PLI as a function of concentration parameter κ and mean μ for samples drawn from the von Mises distribution. Note that while PLV is independent of μ, PLI depends on both κ and μ.
Figure 4
Figure 4
Plot of the monotonic relationship between PLV and the magnitude of cross-correlation, |R12|=κ12κ11κ22, for the bivariate circularly symmetric Gaussian model.
Figure 5
Figure 5
Plots of sample (a) PLV and (b) PLI as a function of cross-correlation magnitude |R12|=κ12κ11κ22 and phase μ12 for the bivariate circularly symmetric Gaussian distribution. Similarly to the von Mises distribution, PLV is independent of phase while PLI depends on both cross-correlation magnitude and phase. Samples were drawn from relative phase distribution in equ. (23).
Figure 6
Figure 6
Plot of bias and variance for the sample PLV, root of unbiased sample PLV, and PLV computed from sample cross-correlation. (a) plot of the mean over 1,000 Monte Carlo trials as a function of number of samples used to estimate the parameter for two different values of cross-correlation; (b) corresponding plot of variance for each of the three estimators for the two different cross-correlation values. Samples were drawn independently from bivariate Gaussian processes.
Figure 7
Figure 7
Roessler oscillator simulations (a) Comparison of ROC curves of PLV^circgauss (blue) and PLV^sample (red) when ε = 0.15 for coupled oscillators, standard deviation σ = 1.5 and number of samples L = 5000. (b) Area under ROC curve as a function of coupling parameter ε when σ = 1.5 and L = 5000. (c) Area under ROC curve as a function of number of samples L when σ = 1.5 and ε = 0.15. (d) Area under ROC curve as a function of the standard deviation of the noise σ when L = 5000 and ε = 0.15.
Figure 8
Figure 8
Locations of 15 electrode pairs in the right hemisphere (reproduced from Liang et al. (2001))
Figure 9
Figure 9
Four visual cues represented to the monkey in the experiment (a) right slanted line (b) left slanted line (c) right slanted diamond (d) left slanted diamond.
Figure 10
Figure 10
Goodness of fit between empirical distribution of relative phase extracted from LFP data and parametric von Mises and circularly symmetric Gaussian distributions. The concentration parameter (von Mises) and cross-correlation parameter (Gaussian) were directly estimated from the sample data. (a–c) pairs at 120 msec (d–h) pairs at 260 msec
Figure 11
Figure 11
Scatter plot of PLV^vonimises versus PLV^circgauss computed from macaque LFP data.
Figure 12
Figure 12
Phase synchronization networks constructed from the results in Table 2. Green: significant PLVs occur when diamond is presented. Magenta: significant PLVs occur when line is presented. Blue: significant PLVs occur during go condition. Red: significant PLVs occur during no-go condition. The thickness of the edges represents the number of experiments sessions in which significant synchronization occurs.

References

    1. Amor F, Rudrauf D, Navarro V, Ndiaye K, Garnero L, Martinerie J, Le Van Quyen M. Imaging brain synchrony at high spatiotemporal resolution: application to meg signals during absence seizures. Signal processing. 2005;85:2101–2111.
    1. Aviyente S, Bernat E, Evans W, Sponheim S. A phase synchrony measure for quantifying dynamic functional integration in the brain. Human brain mapping. 2010;32:80–93. - PMC - PubMed
    1. Baillet S, Mosher J, Leahy R. Electromagnetic brain mapping. Signal Processing Magazine, IEEE. 2001;18:14–30.
    1. Bhattacharya J, Petsche H, Feldmann U, Rescher B. Eeg gamma-band phase synchronization between posterior and frontal cortex during mental rotation in humans. Neuroscience Letters. 2001;311:29–32. - PubMed
    1. Bressler S. Large-scale cortical networks and cognition. Brain Research Reviews. 1995;20:288–304. - PubMed

Publication types