

Estimating the relative contribution of parasitic infections and nutrition for anaemia among school-aged children in Kenya: a subnational geostatistical analysis
- PMID: 23435794
- PMCID: PMC3586185
- DOI: 10.1136/bmjopen-2012-001936
Estimating the relative contribution of parasitic infections and nutrition for anaemia among school-aged children in Kenya: a subnational geostatistical analysis
Abstract
Objectives: To quantify geographical variation in the relative contribution of parasitic infections, socioeconomic factors and malnutrition in the aetiology of anaemia among schoolchildren across Kenya, thereby providing a rational basis for the targeting of an integrated school health package.
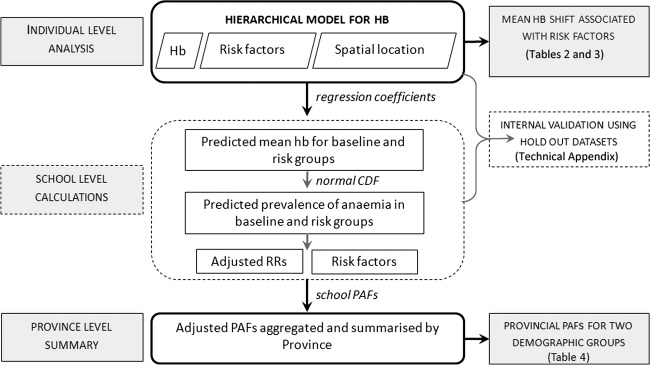
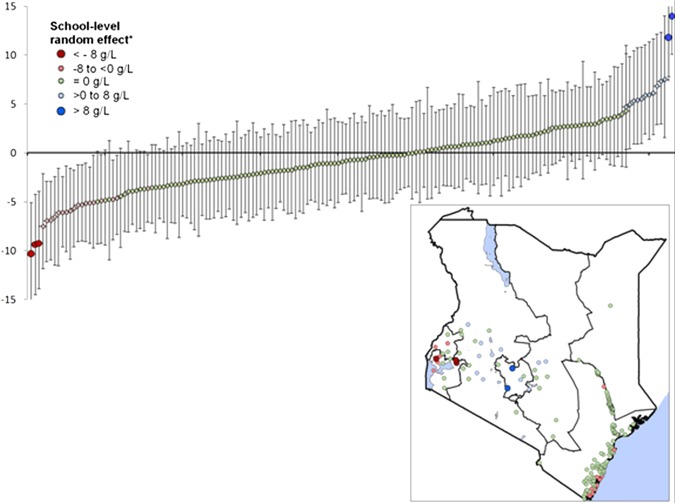
Design: Nationally representative cross-sectional survey data were collected using standard protocols. For all included children, data were recorded on haemoglobin (Hb) concentration and common parasitic infections (Plasmodium falciparum, hookworm and schistosomes) and socioeconomic indicators. Ecological proxies of malnutrition and food security were generated using Demographic and Health Survey and UN Food and Agriculture Organization food security data, respectively. Spatially explicit, multilevel models were used to quantify impact upon child Hb concentration.
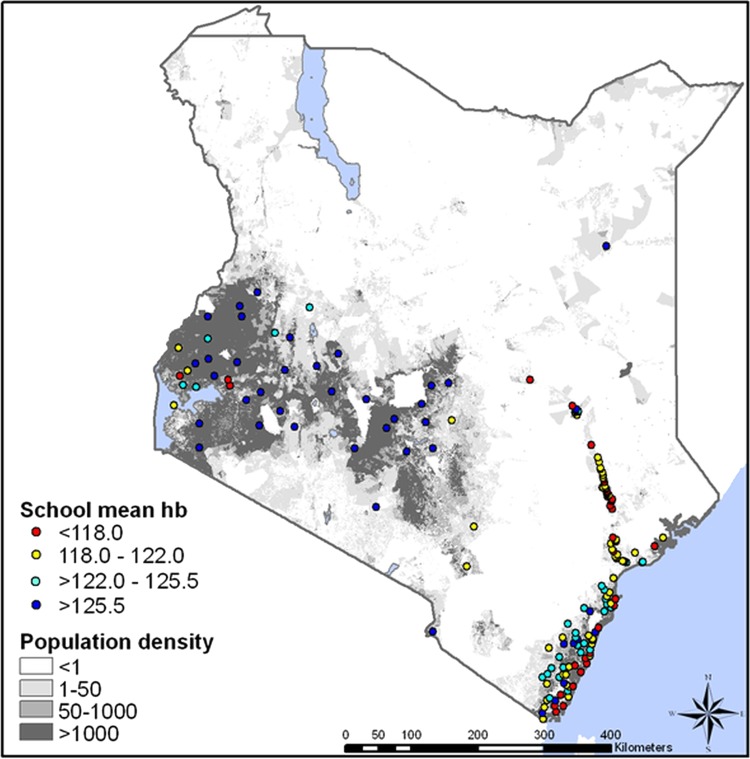
Setting: Randomly selected schools in ecologically diverse settings across Kenya.
Main outcome measures: Mean Hb concentration adjusted for infection, nutritional and socioeconomic risk factors; associated risk ratios and adjusted Population Attributable Fractions (PAFs) for anaemia, by region.
Results: Data were available for 16 941 children in 167 schools; mean Hb was 122.1 g/l and 35.3% of children were anaemic. In multivariate analysis, mean Hb was significantly lower in boys and younger children. Severe malnutrition and interactions between P falciparum and hookworm infections were significantly associated with lower Hb, with greater impacts seen for coinfected children. The contribution of risk factors to anaemia risk varied by province: in 14-year-old girls, PAFs ranged between 0% and 27.6% for P falciparum, 0% and 29% for hookworm and 0% and 18.4% for severe malnutrition.
Conclusions: The observed geographical heterogeneity in the burden of anaemia attributable to different aetiological factors has important implications for the rational targeting of antianaemia interventions that can be included in an integrated school health programme.
Figures
References
-
- United Nations Department of Economic and Social Affairs. World population prospects, 2010 revision. http://esa.Un.Org/unpd/wpp/ (accessed June 2012). - PubMed
-
- Global Partnership for Education. All children learning: Report 2011. Global Partnership for Education. http://allchildrenlearningreport.globalpartnership.org (accessed June 2012).
-
- World Bank Fresh: Focusing resources on education and school health. A fresh start to improving the quality and equity of education. Washington: UNESCO, UNICEF, WHO & World Bank, 2000
-
- McLean E, Cogswell M, Egli I, et al. Worldwide prevalence of anaemia, WHO vitamin and mineral nutritional information system, 1993–2005. Public Health Nutr 2008;12:444–54 - PubMed
-
- Best C, Neufingerl N, Avan Geel L, et al. The nutritional status of school-aged children: why should we care? Food Nutr Bull 2010;31:400–17 - PubMed
Grants and funding
LinkOut - more resources
Full Text Sources
Other Literature Sources