. 2013 Jun;12(6):1709-22.
doi: 10.1074/mcp.M112.024919. Epub 2013 Feb 22.

Initial quantitative proteomic map of 28 mouse tissues using the SILAC mouse

Affiliations

Initial quantitative proteomic map of 28 mouse tissues using the SILAC mouse

Tamar Geiger et al. Mol Cell Proteomics. 2013 Jun.

Abstract

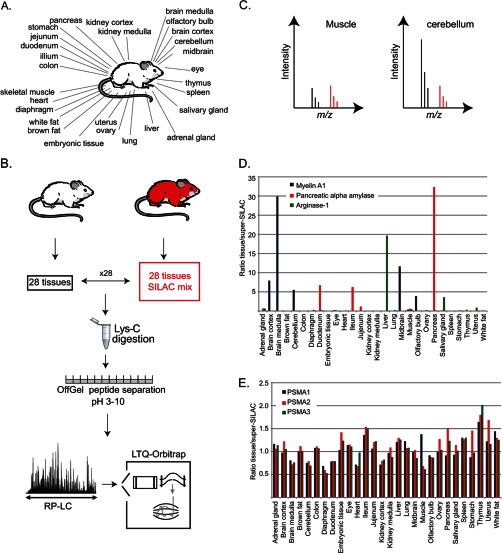
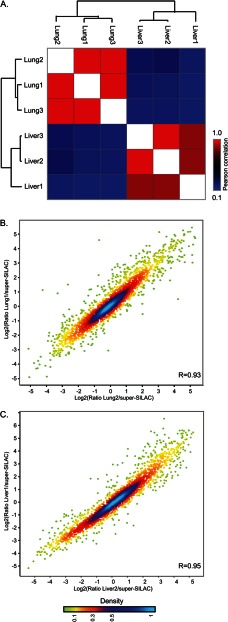
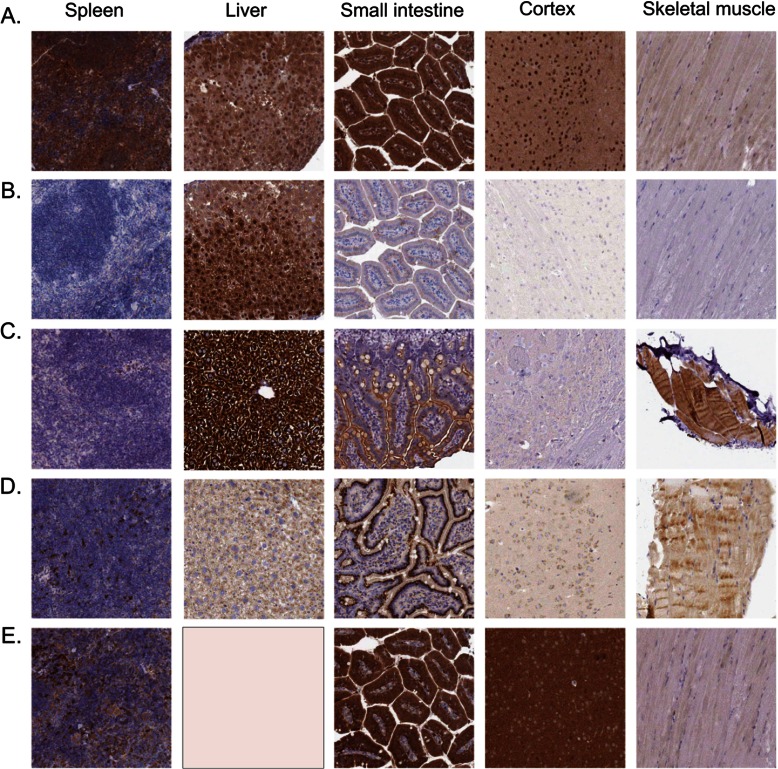
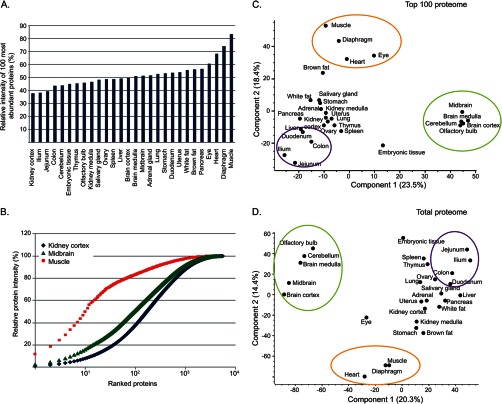
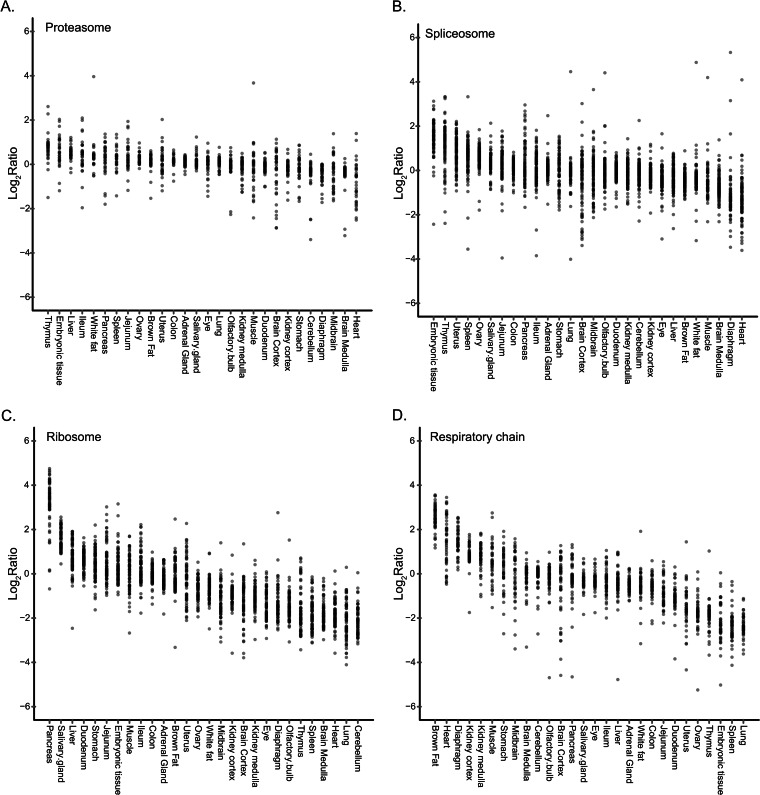
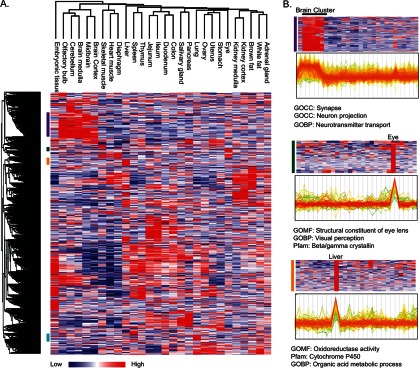
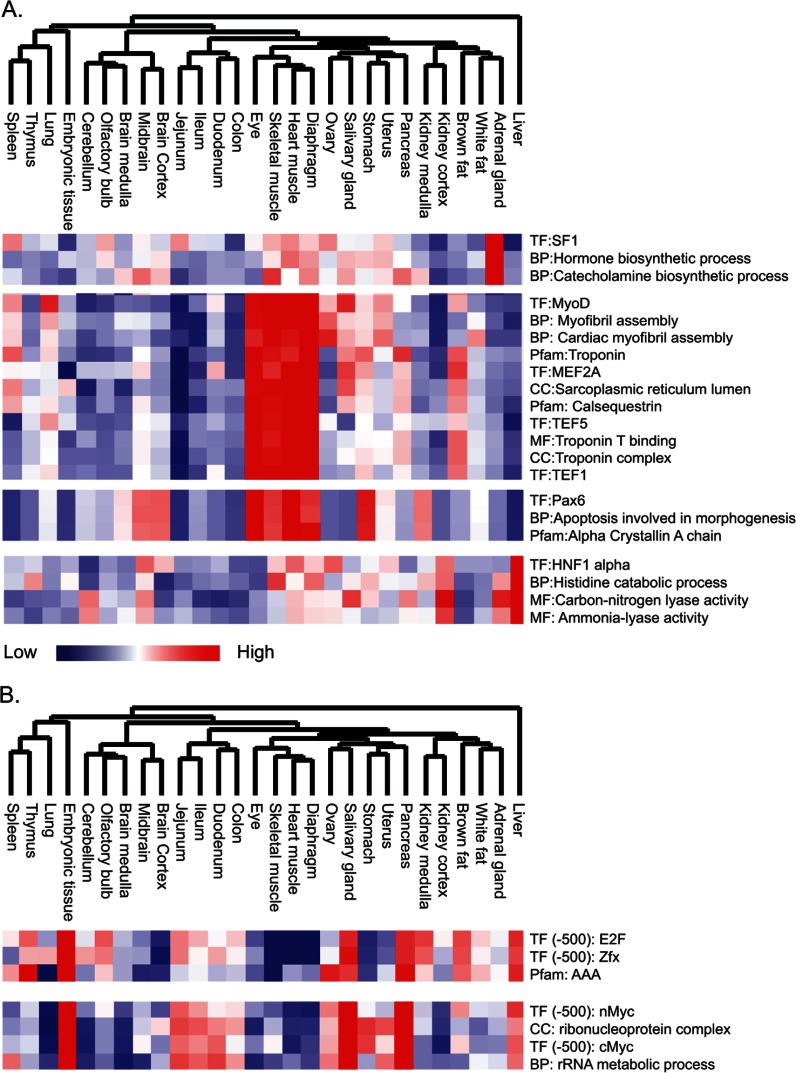
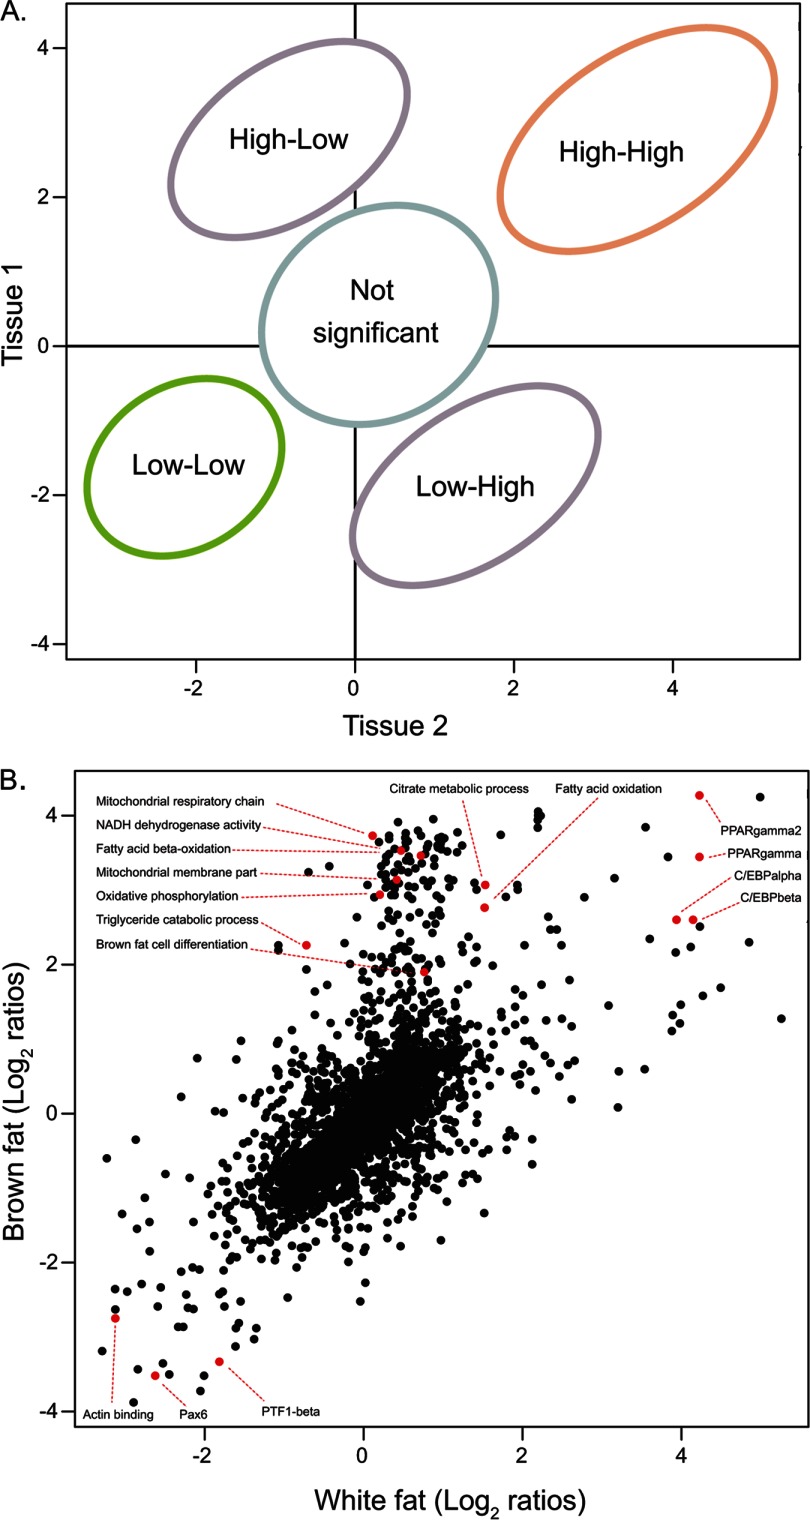
Identifying the building blocks of mammalian tissues is a precondition for understanding their function. In particular, global and quantitative analysis of the proteome of mammalian tissues would point to tissue-specific mechanisms and place the function of each protein in a whole-organism perspective. We performed proteomic analyses of 28 mouse tissues using high-resolution mass spectrometry and used a mix of mouse tissues labeled via stable isotope labeling with amino acids in cell culture as a "spike-in" internal standard for accurate protein quantification across these tissues. We identified a total of 7,349 proteins and quantified 6,974 of them. Bioinformatic data analysis showed that physiologically related tissues clustered together and that highly expressed proteins represented the characteristic tissue functions. Tissue specialization was reflected prominently in the proteomic profiles and is apparent already in their hundred most abundant proteins. The proportion of strictly tissue-specific proteins appeared to be small. However, even proteins with household functions, such as those in ribosomes and spliceosomes, can have dramatic expression differences among tissues. We describe a computational framework with which to correlate proteome profiles with physiological functions of the tissue. Our data will be useful to the broad scientific community as an initial atlas of protein expression of a mammalian species.


Figures

Fig. 1.
Fig. 1.
Proteomic analysis of mouse tissues. A, 28 tissues were isolated from C57BL/6 mice. B, the same tissues were isolated from SILAC mice and combined to create a SILAC mix that served as a spike-in standard. This SILAC reference was mixed with each of the “light” tissues prior to combined protein digestion with Lys-C. Peptides were separated into 12 fractions with an OffGel fractionator and analyzed via LC-MS/MS on the LTQ-Orbitrap. C, peptides from each tissue were quantified relative to the SILAC standard, as illustrated by peptides in the muscle and in the cerebellum that are accurately quantified relative to the same heavy standard. D, the data can serve as a catalogue of expressed mouse proteins across the tissues, as shown by the tissue distribution of three proteins with highly specific expression. E, three proteasomal subunits are similarly expressed in all tissues.
Fig. 2.
Fig. 2.
Reproducibility of proteomic data. Comparison of triplicate analysis of lung and liver tissues shows high correlation between replicates. A, heat map of the Pearson correlations of ratios relative to super-SILAC. B, C, scatter plots comparing replicate lung (B) and liver (C) samples. Color code represents density as indicated in the bar at the bottom.
Fig. 3.
Fig. 3.
Images showing protein expression profiles based on five antibodies, IHC, and bright field microscopy. Protein expression is shown in brown, and counterstaining in blue. All antibodies were obtained from the Human Protein Atlas project. A, the antibody HPA008188 staining PSMA2 shows general, moderate to strong cytoplasmic staining in all tissues. B, the antibody HPA024006 staining ARG1 shows cytoplasmic and nuclear staining of hepatocytes in liver. The remaining tissues were negative. C, the antibody HPA039482 staining GYS2 shows moderate to strong cytoplasmic staining of hepatocytes in liver and myocytes in skeletal muscle. A weaker luminal staining was observed in small intestine, and the remaining tissues were negative. D, the antibody HPA019639 staining CANT1 shows a general cytoplasmic staining of all tissues, with the strongest staining being of small intestine. E, the antibody HPA003565 staining PAK1 shows moderate to strong cytoplasmic staining of neuropil, glandular cells in small intestine, and a subset of the lymphoid cells in spleen.
Fig. 4.
Fig. 4.
Protein abundance in the mouse tissues—the “top-100 proteome.” A, relative abundance of the 100 most abundant proteins in each tissue. Abundance calculation was based on protein intensity relative to the overall intensity of the “light” tissue. B, accumulation of protein mass in kidney cortex, midbrain, and muscle. These tissues represent the extremes and middle values from A. Proteins are rank-ordered according to their intensity. This shows that in muscle, only 10 proteins are responsible for over 50% of tissue mass. C, principal component analysis of the mouse tissues based on the top-100 proteome enables discrimination of the brain and muscle tissues and association of the intestine regions. D, principal component analysis based on the complete dataset shows the same tissue discrimination as the top-100 proteome.
Fig. 5.
Fig. 5.
Co-regulation of molecular complexes in the mouse tissues. The graphs indicate the ratios of the subunits of the proteasome (A), spliceosome (B), ribosome (C), and respiratory chain complex (D) relative to the internal standard in each of the tissues. The subunits of the complexes are co-regulated with a few outliers in each complex, but the overall level of the complex varies between them.
Fig. 6.
Fig. 6.
Unsupervised clustering of mouse tissue proteomes. A, hierarchical clustering of proteins and tissues shows that embryonic tissue is separated from the other tissues and functionally related tissues are co-clustered. B, profile plots show the normalized ratios (z-scored ratios toward the super-SILAC standard) of the brain protein cluster, the eye cluster, and the liver cluster (purple, green, and orange bars in A, respectively). Lines (indicating individual proteins) are colored according to the density of proteins with those ratios. Fisher's exact test (false discovery rate = 0.02) for enrichment analysis of protein annotations in each cluster highlights the tissue-specific annotations.
Fig. 7.
Fig. 7.
Association of transcription factors and biological processes. We created an annotation matrix to globally look at the tissue distribution of annotations (supplemental Fig. S2). A, co-clustering of transcription factor targets from the TRANFAC database with protein families (Pfam) and gene ontology annotations: BP (biological processes), MF (molecular functions), and CC (cellular compartments). Tissue-specific associations are shown for the adrenal gland, muscle tissues, eye, and liver. B, association of transcription factor targets based on ChIP-Seq analysis highlights the tissue specificity of E2F, Zfx, and Myc with AAA proteins and ribosome biosynthesis.
Fig. 8.
Fig. 8.
Protein annotation in brown and white fat tissues. A, schematic graph showing the different zones of the annotation scatter plot. The indicated areas distinguish the annotations that are relevant to both tissues (high-high), the ones that are low in both tissues (low-low), and the ones that are specific to only one of the tissues. B, comparison of annotations between brown and white adipose tissues indicates the prominent role of the transcription factors PPARγ and C/EBP in both tissues, and of metabolic activity specifically in the brown fat tissue.

References

    1. Su A. I., Wiltshire T., Batalov S., Lapp H., Ching K. A., Block D., Zhang J., Soden R., Hayakawa M., Kreiman G., Cooke M. P., Walker J. R., Hogenesch J. B. (2004) A gene atlas of the mouse and human protein-encoding transcriptomes. Proc. Natl. Acad. Sci. U.S.A. 101, 6062–6067 - PMC - PubMed
    1. Ramskold D., Wang E. T., Burge C. B., Sandberg R. (2009) An abundance of ubiquitously expressed genes revealed by tissue transcriptome sequence data. PLoS Comput. Biol. 5, e1000598. - PMC - PubMed
    1. Lundberg E., Fagerberg L., Klevebring D., Matic I., Geiger T., Cox J., Algenas C., Lundeberg J., Mann M., Uhlen M. (2010) Defining the transcriptome and proteome in three functionally different human cell lines. Mol. Syst. Biol. 6, 450. - PMC - PubMed
    1. Nagaraj N., Wisniewski J. R., Geiger T., Cox J., Kircher M., Kelso J., Paabo S., Mann M. (2011) Deep proteome and transcriptome mapping of a human cancer cell line. Mol. Syst. Biol. 7, 548. - PMC - PubMed
    1. Schwanhausser B., Busse D., Li N., Dittmar G., Schuchhardt J., Wolf J., Chen W., Selbach M. (2011) Global quantification of mammalian gene expression control. Nature 473, 337–342 - PubMed

Publication types