. 2012 Dec 15:330-332:63-70.
doi: 10.1016/j.ijms.2012.10.010. Epub 2012 Oct 23.

Theory of the Protein Equilibrium Population Snapshot by H/D Exchange Electrospray Ionization Mass Spectrometry (PEPS-HDX-ESI-MS) Method used to obtain Protein Folding Energies/Rates and Selected Supporting Experimental Evidence

Affiliations

Theory of the Protein Equilibrium Population Snapshot by H/D Exchange Electrospray Ionization Mass Spectrometry (PEPS-HDX-ESI-MS) Method used to obtain Protein Folding Energies/Rates and Selected Supporting Experimental Evidence

Rohana Liyanage et al. Int J Mass Spectrom. .

Abstract

Protein equilibrium snapshot by hydrogen/deuterium exchange electrospray ionization mass spectrometry (PEPS-HDX-ESI-MS or PEPS) is a method recently introduced for estimating protein folding energies and rates. Herein we describe the basis for this method using both theory and new experiments. Benchmark experiments were conducted using ubiquitin because of the availability of reference data for folding and unfolding rates from NMR studies. A second set of experiments was also conducted to illustrate the surprising resilience of the PEPS to changes in HDX time, using staphylococcal nuclease and time frames ranging from a few seconds to several minutes. Theory suggests that PEPS experiments should be conducted at relatively high denaturant concentrations, where the protein folding/unfolding rates are slow with respect to HDX and the life times of both the closed and open states are long enough to be sampled experimentally. Upon deliberate denaturation, changes in folding/unfolding are correlated with associated changes in the ESI-MS signal upon fast HDX. When experiments are done quickly, typically within a few seconds, ESI-MS signals, corresponding to the equilibrium population of the native (closed) and denatured (open) states can both be detected. The interior of folded proteins remains largely un-exchanged. Amongst MS methods, the simultaneous detection of both states in the spectrum is unique to PEPS and provides a "snapshot" of these populations. The associated ion intensities are used to estimate the protein folding equilibrium constant (or the free energy change, ΔG). Linear extrapolation method (LEM) plots of derived ΔG values for each denaturant concentration can then be used to calculate ΔG in the absence of denaturant, ΔG(H(2)O). In accordance with the requirement for detection of signals for both the folded and unfolded states, this theoretical framework predicts that PEPS experiments work best at the middle of the denaturation curve where natured and denatured protein molecules are equilibrated at easily detectable ratios, namely 1:1. It also requires that closed and open states have lifetimes measurable in the time frame of the HDX experiment. Because both conditions are met by PEPS, these measurements can provide an accurate assessment of closed/open state populations and thus protein folding energies/rates.


Figures

Figure 1
Figure 1
a) Raw ESI and b) deconvoluted mass spectra; of ubiquitin, for one second HDX PEPS taken close to the midpoint of the linear denaturation curve. Clearly resolved peaks corresponding to deuterated closed and open states can be seen in every charge state and at all four GdHCl concentrations.
Figure 2
Figure 2
Classical “breathing model” of HDX with a two state folding mechanisms [21, 22, 23]. Only globally protected amide protons are shown in its exposed denatured (open) state. These protected amide protons can exchange only when the protein opens up using the classical HDX model. kclose, and kopen are given by rates of folding and unfolding of the protein. kintH/D is the rate of H/D exchange of a unprotected amide proton.
Figure 3
Figure 3
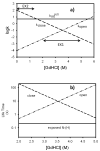
a) Folding and unfolding rates of ubiquitin with the intrinsic H/D exchange rate of an exposed amide proton. Folding/unfolding rates for ubiquitin were obtained from H/D exchange studies of globally protected amide protons at 10° C by NMR [4]. --- (Dash), -..- (Dash double dot), and — (Solid) lines represent folding rate, unfolding rate, and H/D exchange rate of an exposed amide proton [10] as a function of GdHCl concentration. b) Life times of closed (folded) and open (unfolded) states of ubiquitin with the life time of an exposed amide proton. Similar to a), --- (dash), -..- (dash double dot), and — (solid) lines represent the life time of the closed, open, and exposed amide proton as a function of GdHCl concentration.
Figure 4
Figure 4
Shows the movement between closed and open state as a function of both time and the GdHCl concentration for the ubiquitin calculated using known kclose (folding) and kopen (unfolding) rates at 10° C. -- line is the fraction of the closed state at t=0, and --..-- line is the fraction of open state population at t=0. Solid square (□) represents fraction of the open state remained in the open state while the solid Δ represents the fraction of the closed state remained in closed configuration after one second. Likewise, open square (□) represents the fraction of the open state remain in the open state while open triangle (Δ) represents the fraction of the closed state remained in the closed configuration after five seconds.
Figure 5
Figure 5
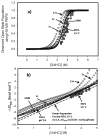
a) Compares open state population obtained using PEPS-HX-ESI-MS theory described in the theory section as a function of GdHCl concentration for 1s (open square, □), 5s (open triangle, Δ), 15s (open diamond, ◇), and 50ms (at pH~10, open circle, o) HDX time to the NMR, 10° C, population (solid line) and population estimated using 1s PEPS (solid circle, o) experiments at 25° C. b) Compares linear extrapolation plots (LEM plots) generated by the equation 7 and (8) described in the PEPS theory section for 1s (open square, □), 5s (open triangle, Δ), 15s (open diamond, ◇), and 50ms (at pH~10, open circle, o) HDX time to the data from NMR, 10° C experiments (solid line), and data from one second PEPS experiments at 25° C (solid circle, o).
Figure 6
Figure 6
Comparison of linear extrapolation plots (LEM plots) for 1s (open circle, o), 5s (open triangle,▲), 15s (open square,□), 1.5 min (solid square), 11 min (solid triangle), and 19 min (solid circle) HDX times PEPS experiments to the data from fluorescence, 25° C, (solid line).
Figure 7
Figure 7
PEPS estimated staphylococcal nuclease wild type folding (kclose, solid circle, o) and unfolding (kopen, open circle, o) rates for varying concentration of GdHCl concentrations using equations 9 and 10 and 1,5 and 15s experiments (averaged). The solid trend line for kclose is given by the equation −2.8x + 1 with a 0.96 correlation coefficient and the dash-dot-dash (-.-) line for kopen is given by the equation 1.7x - 2.8 with a 0.85 correlation coefficient. The graph also compares the staphylococcal nuclease folding/unfolding rates with that of ubiquitin. The dashed line denotes kclose, and the dash-dot-dot-dash (-..-) line denotes kopen.

References

    1. Dobson CM. Trends Biochem. Sci. 1999;24:329. - PubMed
    1. Brandts JF, Lin LN. Biochemistry. 1990;29:6927. - PubMed
    1. Hill JJ, Royer CA. Methods Enzymol. 1997;278:390. - PubMed
    1. Sivaraman T, Arrington CB, Robertson AD. Nat. Struct. Biol. 2001;8:331. - PubMed
    1. Calhoun LN, Liyanage R, Lay JO, Kwon Y. BMC Microbiology. 2010;10:249. - PMC - PubMed

LinkOut - more resources